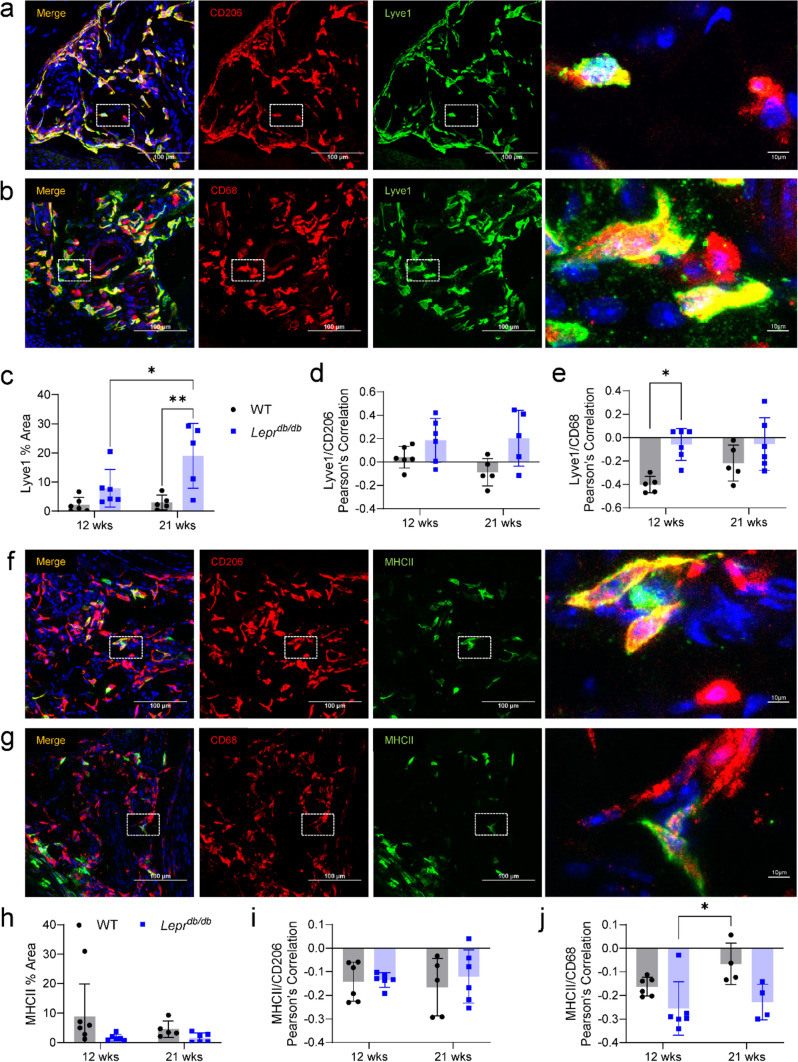
Fig. 9.
Histological characterization of Lyve1+ and MHCIIhi macrophages. a Representative image of Lyve1 and CD206 colocalization (white dotted box = the area magnified in the right-most image on each row). b Representative image of Lyve1 and CD68 colocalization. c Quantification of Lyve1+ percent area from co-staining with CD206 shows a significant increase in the percent area of Lyve1 in 21-week-DB mice as compared to all other groups. Pearson’s correlation for Lyve1 with d CD206 and e CD68 revealed a positive correlation between Lyve1 and CD206 and a significant increase in the correlation between Lyve1 and CD68 in the 12- and 21-week-DB mice as compared to 12-week-WT mice. f Representative image of MHCII and CD206 colocalization. g Representative image of MHCII and CD68 colocalization. h Quantification of MHCII percent area from co-staining with CD206 shows no significant differences between groups. Pearson’s correlations for MHCII with both i CD206 and j CD68 revealed a negative correlation between MHCII and CD206 and between MHCII and CD68, although there was a significantly higher colocalization between MHCII and CD68 within 21-week-WT mice as compared to 12-week-DB mice. *p < 0.05: **p < 0.01. Data are mean ± SD (n = 4–6)

