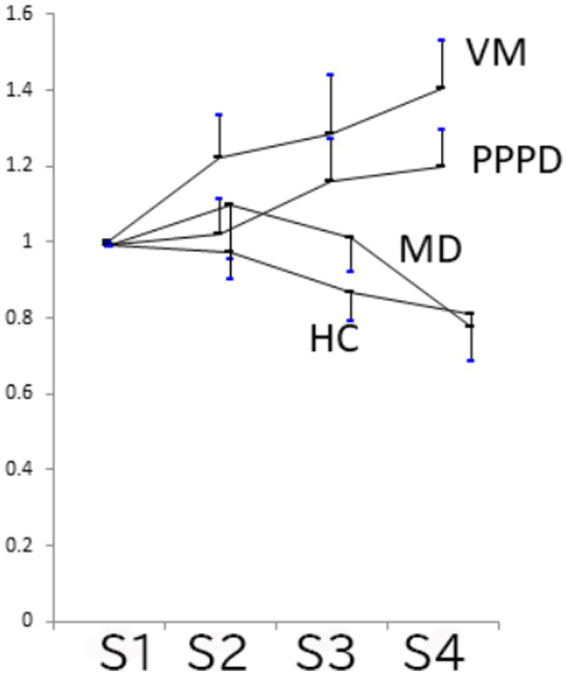
Figure 2.

Relative Na-Pa amplitudes in S2–S4 to S1 (Mean and SE). PPPD and VM showed lack of habituation. Comparison of relative amplitudes showed significant differences among the 4 groups in S4 (p = 0.0013 one-way ANOVA), Multiple comparison concerning PPPD revealed significant differences between PPPD and MD (p = 0.0337 Dunnet’s test). Comparison between PPPD and other groups than MD (=VM and HC) did not show significant difference (p > 0.05 Dunnet’s test).
