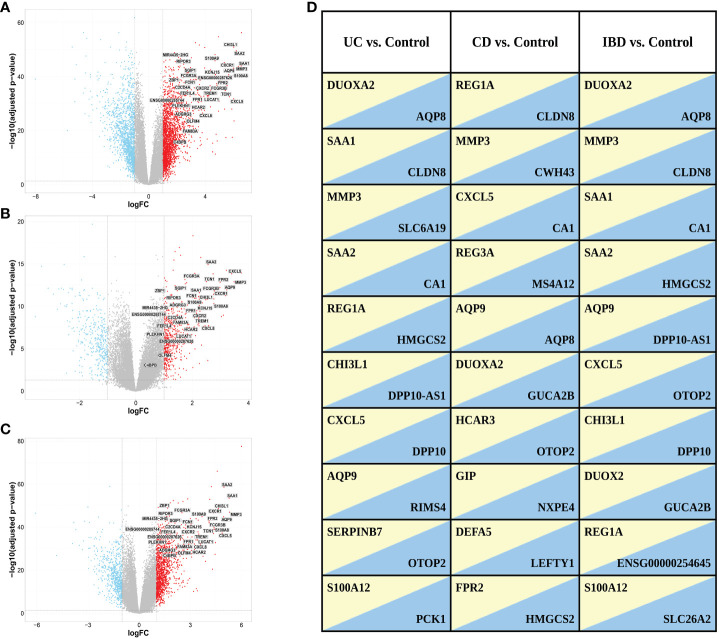
Figure 3.
Volcano plots of DEGs selected with a threshold of adjusted p-value < 0.05 and fold-change >2 for the following comparisons: (A) UC vs. control, (B) CD vs. control and (C) IBD vs. control. Highlighted are the 34 genes found in ML analysis (see ML analysis section below). (D) Top ten up (yellow)- and down (blue)-regulated genes in the different comparisons. Genes with FDR < 0.05 were ranked based on fold change.

