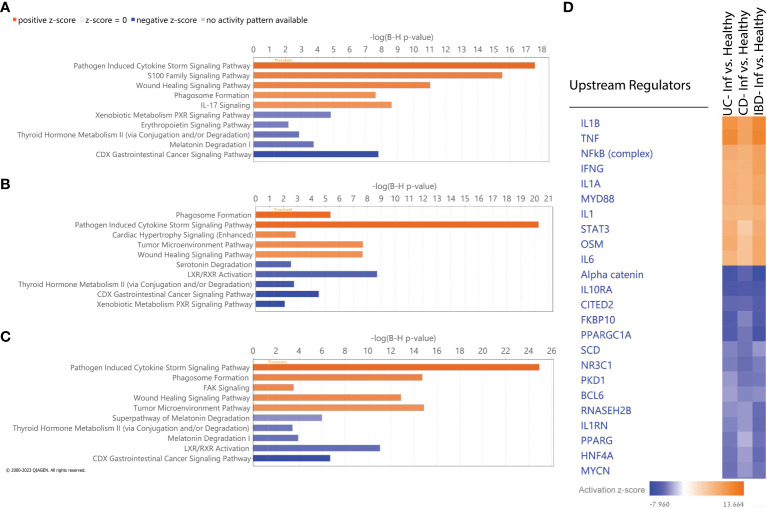
Figure 4.
IPA Functional analysis. (A-C) Top five activated (orange) and inhibited (blue) canonical pathways based on absolute IPA’s activation z-score > 2 for the following comparisons: (A) UC vs non-IBD control, (B) CD vs non-IBD control, (C) IBD vs non-IBD control. Negative z score value implies an overall pathway's inhibition and a positive z-score value suggests an overall pathway's activation. All pathways had -log (B-H p-value) > 1.3 meaning FDR less than 0.05. (D) Hierarchical clustering of upstream regulators’ activation z score across all comparisons.

