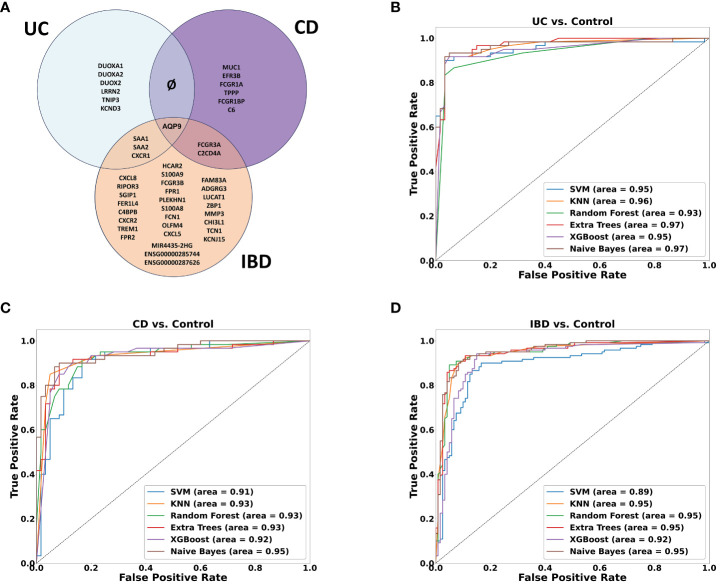
Figure 5.
Machine learning results. (A) Venn diagram showing the overlap between ML-selected discriminative genes for the following comparisons: UC vs. Control, CD vs. Control and IBD vs. Control. (B–D) ROC curve of True positive rate vs. False positive rate at different six models on validation data GSE193677 for (B) UC (C) CD and (D) IBD analyses.

