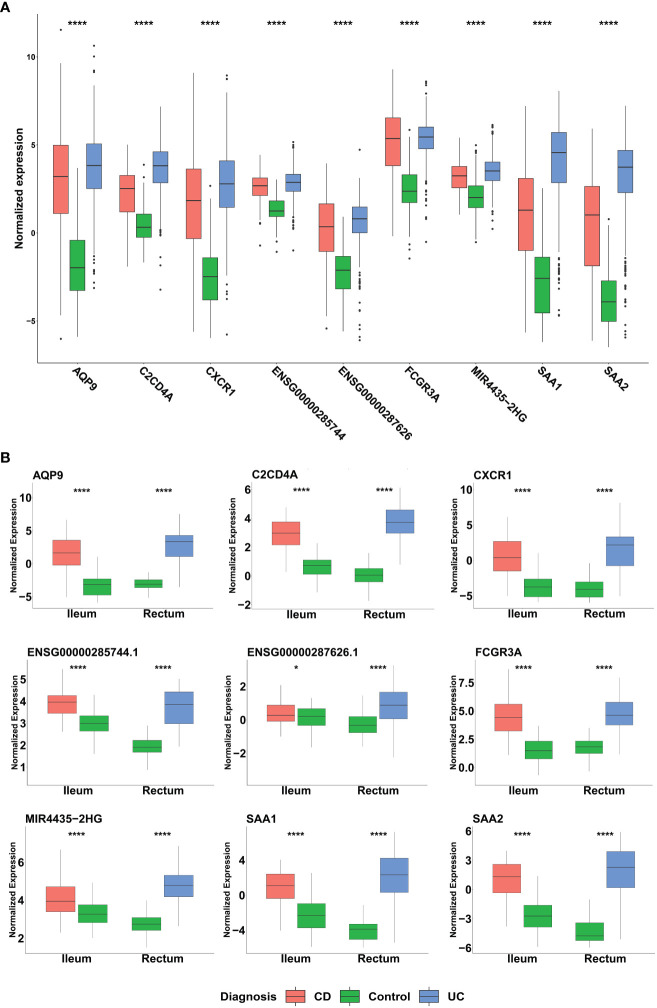
Figure 6.
Distribution of the normalized expression of selected genes across UC, CD and non-IBD control samples in (A) Mega-analysis dataset: CD (n= 183), UC (n= 386) and control group (n=128). P-values were calculated using two-way analysis of variance (ANOVA). (B) GSE193677 validation dataset: The dataset includes inflamed samples from CD (n=60, ileum) and UC (n=60, rectum), along with non-IBD control samples from both the ileum (n=60) and rectum (n=60). Statistical significance was assessed using Student’s t-test. *p < 0.05, ****p < 0.0001 indicate the significance levels.

