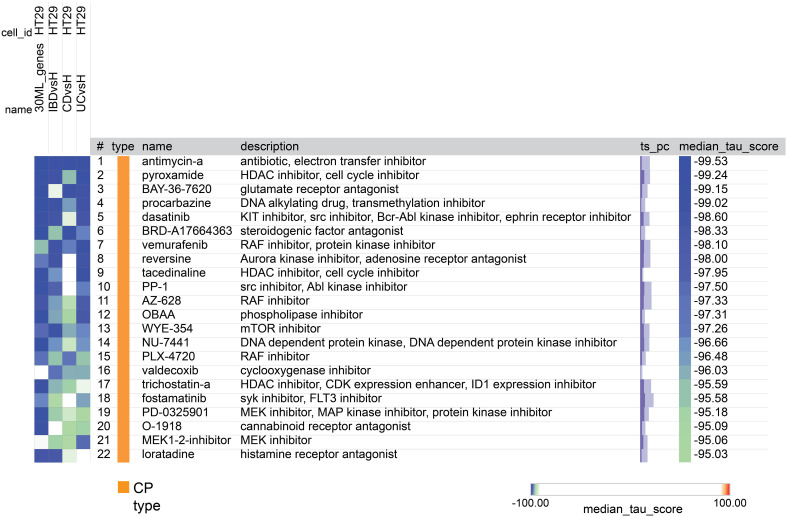
Figure 8.
A heatmap generated by CMap showing the connection, assessed by connectivity score (tau score) between gene expression signature of the 4 groups (columns) and the compounds (rows). The score measures the strength of connection between the query signature and a compound. Compounds are sorted by decreasing order of median score across the four groups. Compounds with median score lower than -95 are considered significant.

