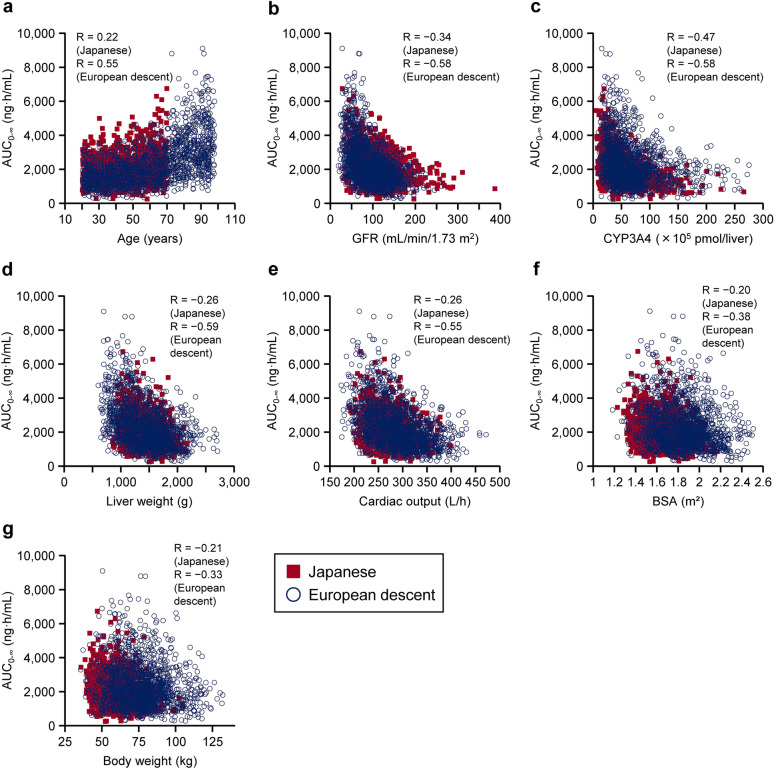
Fig. 2.
Correlations between AUC0–∞ and physiological factors in virtual Japanese and European descent populations after a single dose of 20 mg teneligliptin. AUC0–∞ was plotted against age (a), GFR (b), hepatic CYP3A4 content (c), liver weight (d), cardiac output (e), BSA (f) and body weight (g) for individual virtual subjects aged 20–70 years (Japanese; red-filled squares) or 20–98 years (European descent; blue open circles). The Pearson’s correlation coefficients (R) are provided on each graph. AUC0–∞ Area under the plasma concentration–time curve from 0 h to infinity, BSA body surface area, CYP3A4 cytochrome P450 3A4, GFR glomerular filtration rate

