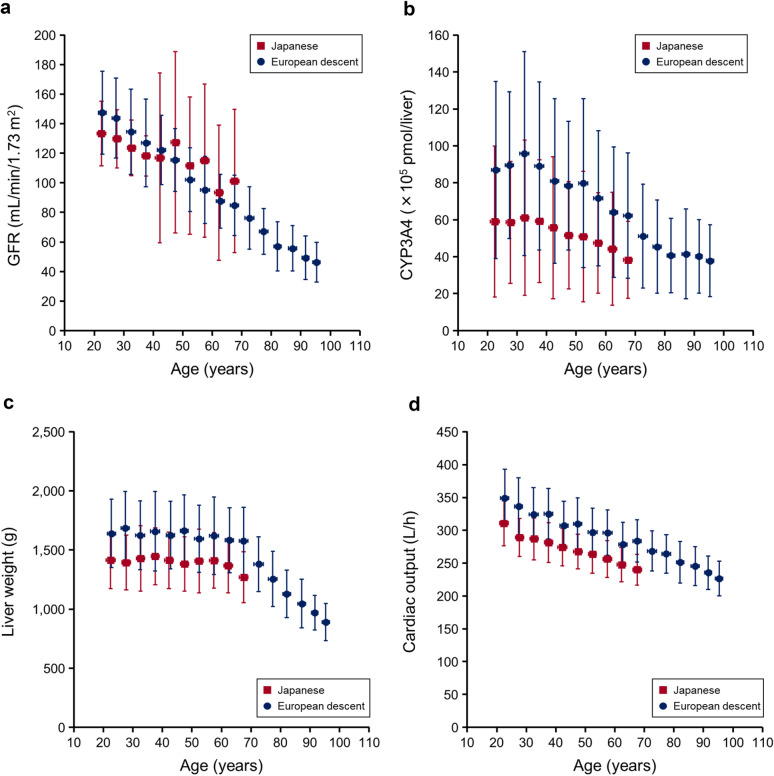
Fig. 3.
Age-related changes in the physiological factors correlated with AUC in the virtual populations. Age versus GFR (a), hepatic CYP3A4 content (b), liver weight (c) and cardiac output (d). Values are shown as the mean ± standard deviation for age and each physiological factor in Japanese (20–70 years old; red-filled squares) and European descent populations (20–98 years old; blue-filled circles). Age was divided into 5-year categories (4-year categories for subjects aged ≥ 90 years). AUC Area under the plasma concentration-time curve, CYP3A4 cytochrome P450 3A4, GFR glomerular filtration rate

