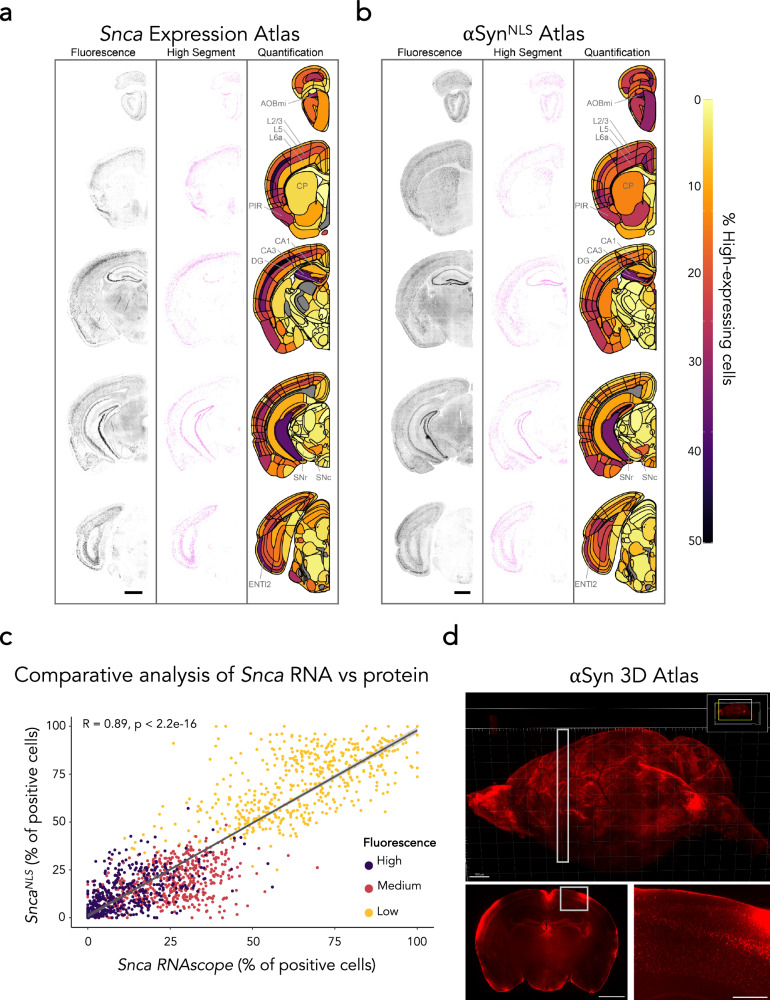
Fig. 1. A brain-wide atlas of αSyn topography.
RNAScope performed on a wild-type mouse to measure Snca expression (a) and immunofluorescent staining performed on a mouse brain measuring αSyn protein density (b) throughout the brain. Staining (left), segmentation (middle, high threshold), and heatmap (right) show brain region-specific expression patterns of Snca or αSyn distribution, respectively. Select regions with a large percentage of high-expressing cells (AOBmi accessory olfactory bulb, mitral layer, PIR piriform area, BLAa basolateral amygdalar nucleus, anterior part, CA3 field CA3 of hippocampus, DG dentate gyrus, SNc substantia nigra, compact part, ENTl2 entorhinal area, lateral part, layer 2) or lower percentage (CP caudoputamen, CA1: field CA1 of hippocampus, SNr substantia nigra, reticular part) are labeled. Cortical layers are also highlighted since these show clear differences in the percentage of high-expressing cells (L2/3: layer 2/3, L5: layer 5, L6a: layer 6a). Scale bars: 1000 μm. c A comparative analysis of (a) and (b) indicating correlation of topography between Snca RNAScope in wildtype mice and αSyn immunofluorescence in SncaNLS mice for different intensity cut-offs. Dots represent class prevalence from individual regions. The solid line represents the line of best fit, and the shaded ribbons represent the 95% prediction intervals. The R and p values for the Pearson correlation between protein and gene expression are noted on the plots. d Representative images of whole brain Flag epitope staining and imaging provide an encompassing view of αSyn topography. White boxes indicate insets. Scale bars: 1000 μm (d top, d bottom left), 250 μm (d bottom right).

