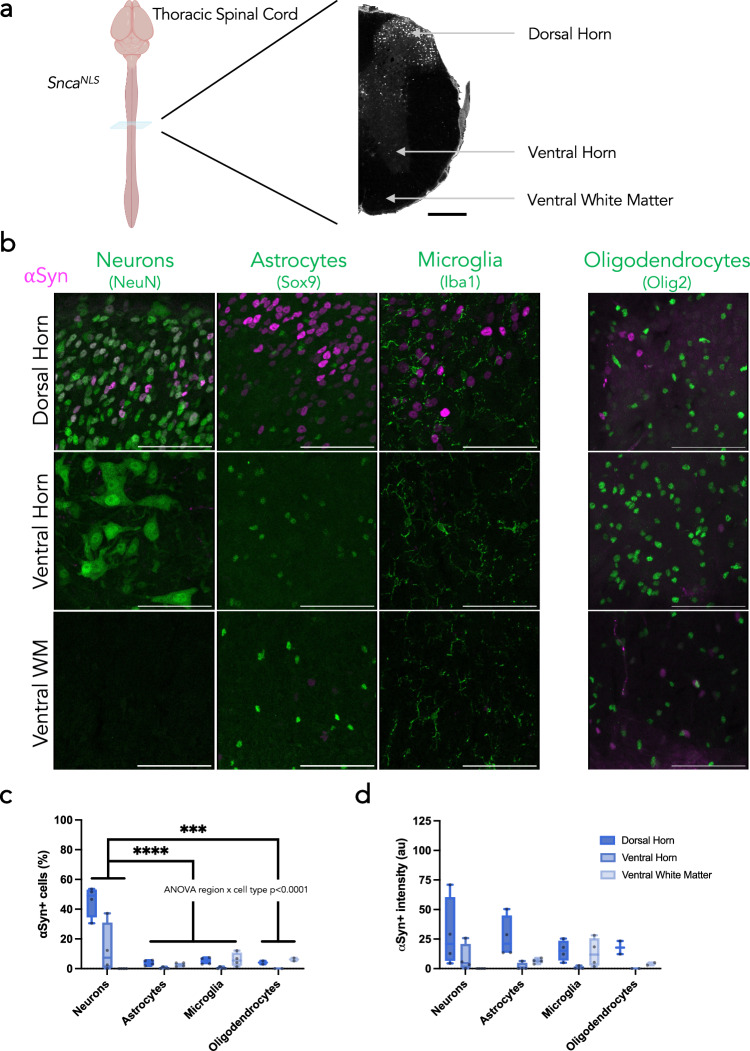
Fig. 4. Diverse αSyn topography within the mouse spinal cord.
a Coronal plane chosen to assess different regions of the thoracic spinal cord in SncaNLS mice (left) with annotations for the dorsal and ventral horns and ventral white matter (right) from a section stained for αSyn. Scale bar: 1000 μm. b Merged micrographs from the dorsal horn (upper), ventral horn (middle), and ventral white matter (bottom) staining for neurons (left), astrocytes (middle left), microglia (middle right), and oligodendrocytes (right; different staining paradigm). Scale bars: 75 μm. From these, αSyn density (c) and intensity (d) were quantified. Plotted as box plot with min to max bars. Two-way ANOVA with Tukey’s post hoc, ***, **** denotes p < 0.001 and p < 0.0001, respectively.

