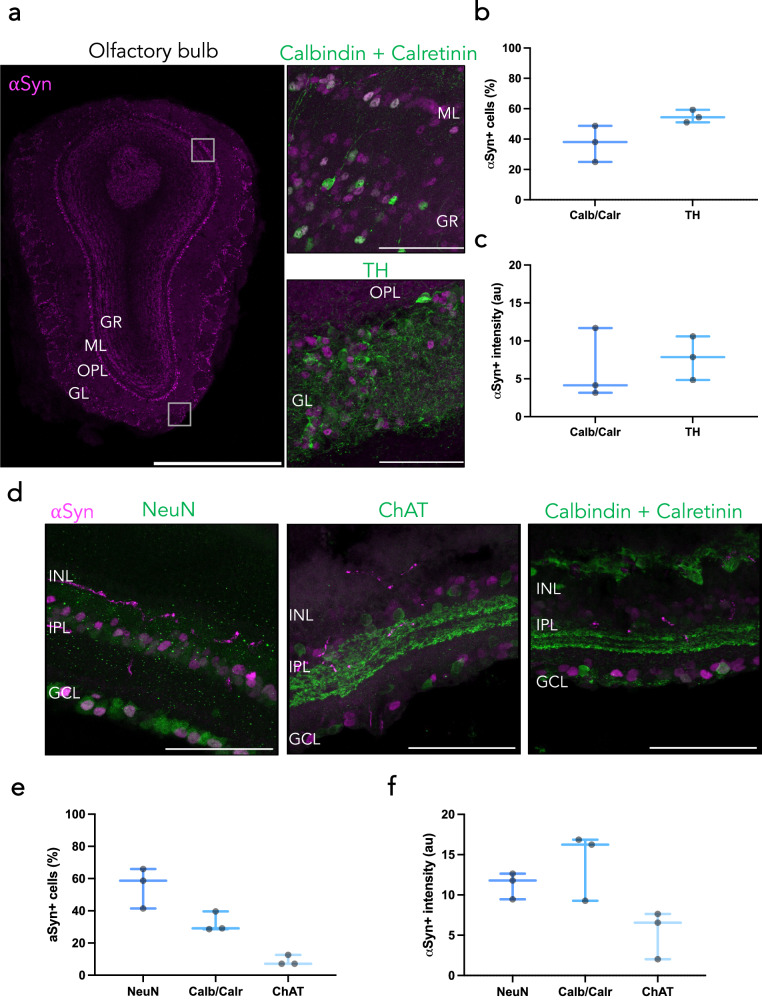
Fig. 5. Diverse αSyn staining patterns within the mouse olfactory bulb and retina.
a Tiled immunofluorescent image of an olfactory bulb (left; scale bar: 1000 μm) shows region-specific topography of αSyn, specifically colocalizing with calbindin/calretinin in the mitral layer (upper right) and TH in the glomerular layer (lower right). Scale bars: 75 μm. From these, αSyn density (b) and intensity (c) were quantified. Plotted as box plots with min to max bars. d Cross section of SncaNLS retina co-stained for NeuN (left) ChAT (middle) or calbindin/calretinin (right). From these, αSyn density (e) and intensity (f) were quantified. Plotted as box plots with min to max bars. Glomerular layer (GL), outer plexiform layer (OPL), mitral layer (ML), granule layer (GR), ganglionic cell layer (GCL), inner plexiform layer (IPL), inner nuclear layer (INL).

