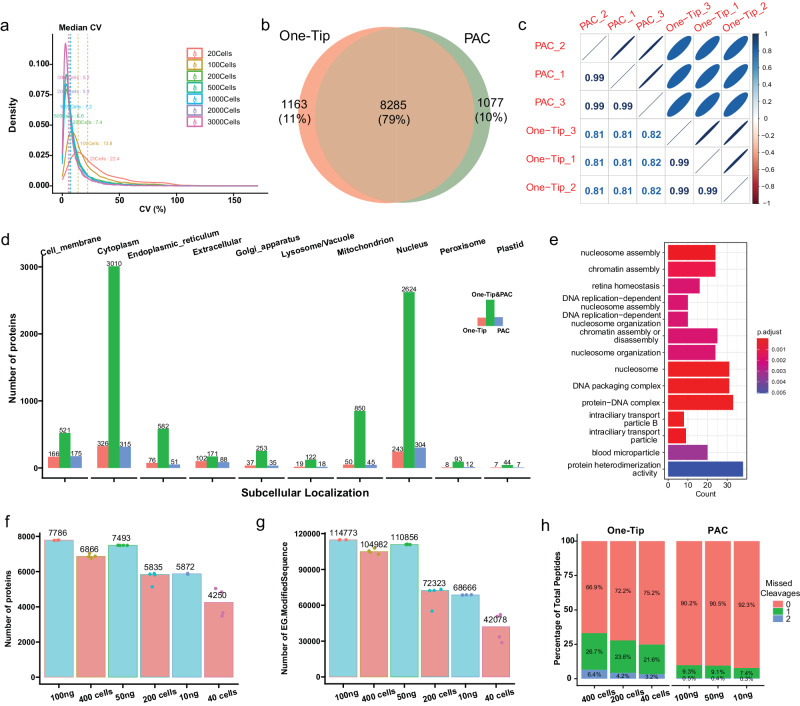
Fig. 2. One-Tip shows precise quantification and comparable proteome coverage with PAC.
a Distribution of coefficient of variance between triplicates in different number of cells. b Overlap of proteins identified in One-Tip (1000 cells) and PAC (1000 ng) workflows. c Correlation of protein abundances between One-Tip and PAC samples. d Subcellular localization of proteins identified in One-Tip and PAC samples. e GO over-representation enrichment of proteins identified only in One-Tip samples. P values were calculated using a one-sided Fisher’s Exact Test and subsequently adjusted using the Benjamini-Hochberg (BH) correction method. f, g Number of proteins (f) and peptides (g) identified in different number of cells using One-Tip and different peptide loading amounts using PAC. h Percentage of missed cleavages in One-Tip and PAC samples. Source data are provided as a Source Data file.

