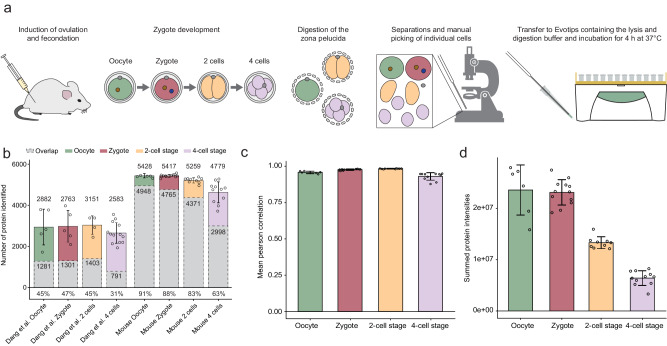
Fig. 3. One-Tip and LC-MS analysis of the mouse pre-implantation embryo until the 4-cell stage.
a Graphic depiction of the workflow using One-Tip for mouse pre-implantation embryos. b Number of proteins with quantified values in the study from Dang et al. and our study, and protein overlap between samples (in grey) from the same development stages. The mean number of proteins for each condition, the overlap and the mean percentage of the overlap compared to each sample are indicated. c Mean correlation of normalized protein abundances between samples within each sample groups (oocyte, zygote, 2-cell stage, 4-cell stage). d Summed protein intensities for each group of samples. Error bars represent ± the standard deviation of the mean. Number of biological replicates: n = 6 for oocyte, n = 12 for zygote, n = 9 for 2-cell stage and n = 11 for 4-cell stage. Source data are provided as a Source Data file.

