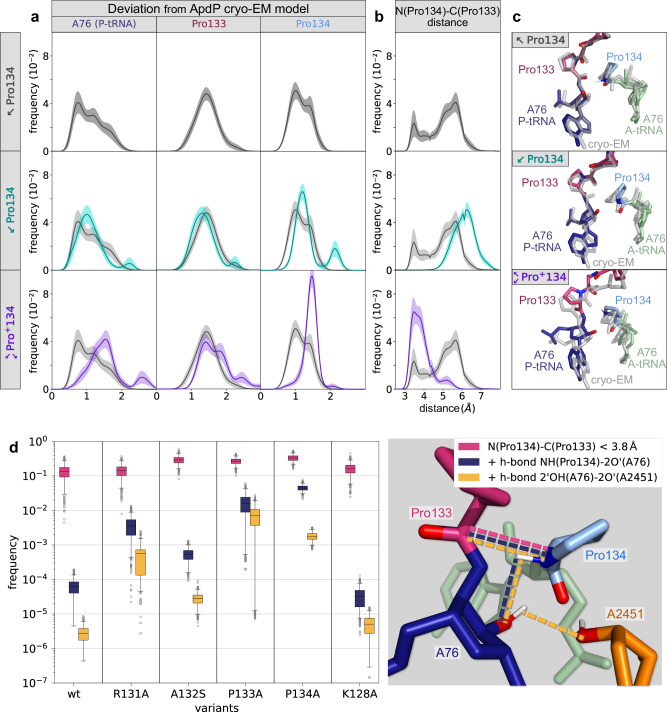
Fig. 6. MD simulations of ApdP in the ribosome.
a, b For different protonation states (Pro134, Pro134, Pro+134), histograms of deviations (rmsd) from the cryo-EM model (ribose ring of A76, Pro134, and Pro133) (a) and of the distances between the α-amino N of Pro134 and the carbonyl C of Pro133 (b) are shown. Uncharged protonation states with the N-H pointing either towards the O (Ala132) or towards O2’ (A76) are denoted by Pro134 and Pro134, respectively. Pro+134 denotes the charged state with both hydrogens. Lines and error bars in (a) and (b) were obtained from the mean and standard deviations of 10,000 bootstraps of 20 independent simulations. c From the MD simulations of each protonation state, structures corresponding to the most probable rmsd values are shown (colored) and compared with the stalled cryo-EM structure (grey). d Frequencies of the conformations fulfilling three conditions required for peptide bond formation. Frequencies of N(Pro134)-C(Pro133) distances lower than 3.8 Å (proximity requirement, magenta). Frequency of conformations which, in addition to the first condition, contain an N-H(Pro134)−2’O(A76) hydrogen bond (blue). Frequency of the conformations that additionally contain the 2’OH(A76)−2’O(A2451) hydrogen bond (yellow). The box plots were obtained by bootstrapping 10,000 samples of 20 independent simulations for each variant. The boxes extend from the first to third quartiles. Whiskers display a 95% confidence interval. Points out of the confidence interval are shown (grey circles). Source data can be obtained from Zenodo (10.5281/zenodo.10426362).

