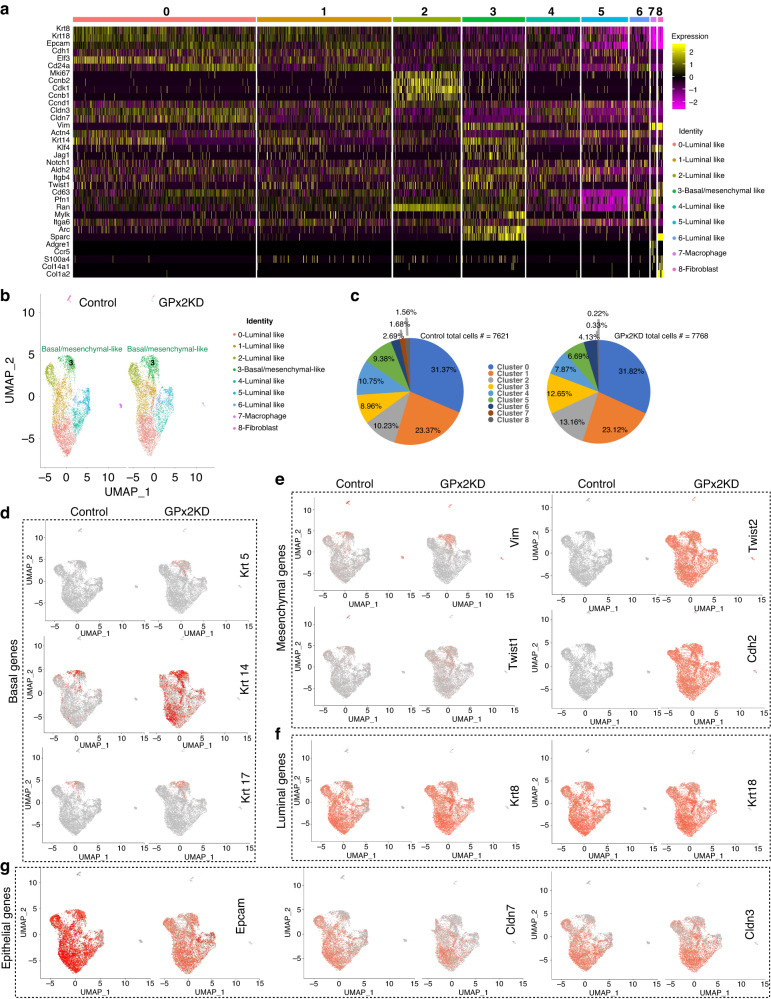
Fig. 1. GPx2 KD stimulates mesenchymal gene expression in M-cluster 3 and luminal clusters.
a Heatmap shows manually supervised-automated clustering of individually selected marker genes from integrated PyMT1/GPx2KD and control PyMT1 single cell RNA datasets. b UMAP projection of comprehensively integrated clustering results from one PyMT1 control and one PyMT1/GPx2 KD tumour revealed six luminal-like clusters (cluster 0, 1, 2, 4, 5, 6), one basal/mesenchymal-like cluster (cluster 3), and two non-epithelial clusters (clusters 7 and 8). c Pie graphs display the percentage of cells in each cluster in GPx2 KD vs control tumour. Pearson’s Chi-square test, p value = 2.2e−16; two-sample test for equality of proportions with continuity correction, data c (983, 683) out of c(7768, 7621), p value = 1.03e−13. d–g Feature plots in low-dimensional space showing expression of basal genes (Krt5, Krt14, Krt17) (d), mesenchymal genes (Vim, Twist1, Twist2, Cdh2) (e), luminal genes (Krt8 and Krt18) (f), epithelial genes (Epcam, Cldn3/7) (g) in the GPx2 KD tumour relative to control tumour.

