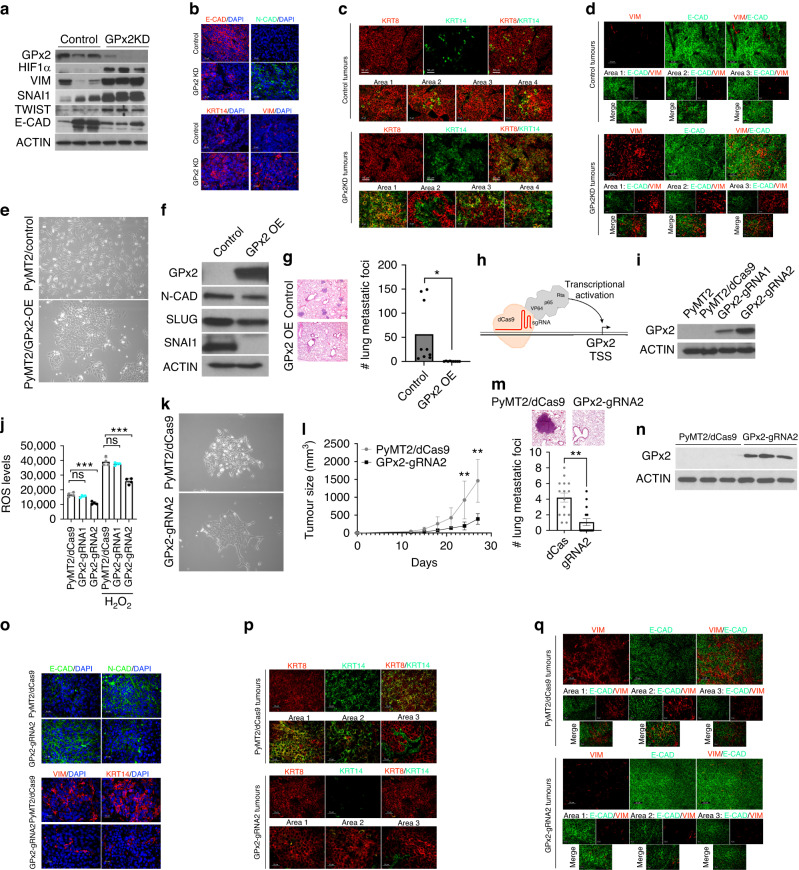
Fig. 2. GPx2 KD promotes EMT dynamics in vivo that were reversed by GPx2 gain of function.
a Western blots of PyMT1/GPx2 KD vs control PyMT1 tumour lysates (n = 3 mice), for expression of GPx2, HIF1α, VIM, SNAI1, TWIST, E-CAD relative to ACTIN. b Immunofluorescent (IF) staining for E-CAD, N-CAD, KRT14, VIM in GPx2 KD vs control tumours (n = 5 mice; 3 sections each). c, d IF staining for KRT8 and KRT14 (c), VIM and E-CAD (d) in control and GPx2 KD tumours (n = 5 mice); Representative images illustrate different EMT states in various tumour areas. (E) Phase-contrast images of PyMT2 cells and PyMT2/GPx2OE cells at ×10 magnification. f Western blots of PyMT2 and PyMT2/GPx2OE cell lysates for expression of GPx2, N-CAD, SLUG, SNAI1 vs ACTIN. g Bar graphs show the number of metastatic foci per lung section (n = 3) from 3 female athymic mice that were tail-vein injected with PyMT2 vs PyMT2/GPx2OE cells; Mean ± SEM; *p < 0.05. Images of lung foci are shown. h Schematic of the sgRNA-dCas9-VPR complex. Transactivators VP64, p65, and Rta were directly fused with C-terminal of dCas9. i Two GPx2 targeting sgRNAs-dCas9-VPR were used to endogenously activate GPx2 expression in PyMT2 cells, and dCas9-VPR without sgRNA was used as control. j ROS levels are shown as Mean ± SEM; ***p < 0.001, ns indicates non-significance. k Phase-contrast images of PyMT2/dCas9 control and PyMT2/GPx2-gRNA2 cells at 10x magnification. l Control and GPx2-gRNA2 cells (1 × 10⁶) were bilaterally injected into mammary fat pads of female athymic nude mice (n = 3 each group). Tumour growth curves over 28 days post tumour onset are shown as Mean of tumour volume ± SEM; **p < 0.01. m Scans of H&E stained sections of lung (boxes) from mice carrying control or GPx2-gRNA2 tumours (upper panels); Graph showing average number of foci per lung section (n = 5) from 3 mice per group; Mean ± SEM; ***p < 0.001. n IB shows GPx2 vs ACTIN in GPx2-gRNA2 vs control PyMT2 tumours (n = 3 mice). o IF images from E-CAD vs N-CAD (top panels) and KRT14 vs VIM (bottom panels) in GPx2-gRNA2 vs control tumours (n = 6). p, q Co-staining of KRT8/KRT14 (p) (top), VIM/E-CAD (q) (bottom) in GPx2-gRNA2 vs control tumours (n = 6); 3 mice each.

