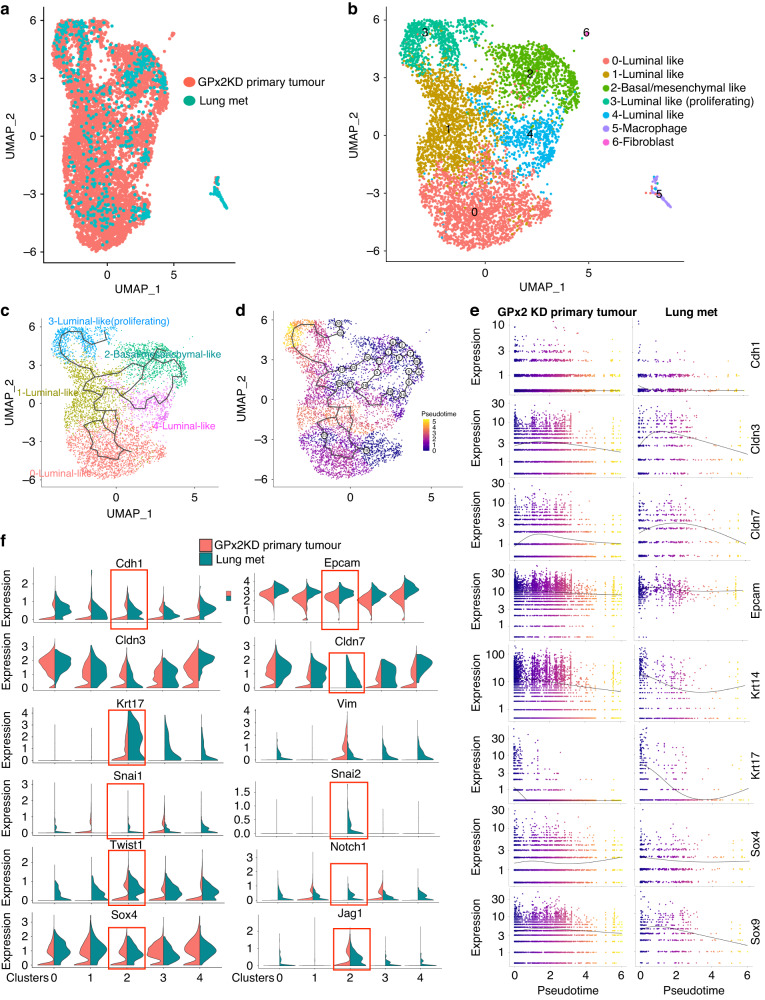
Fig. 3. Pseudotime trajectory analysis illustrates the transcriptional EMT/MET continuum between clusters from primary GPx2 KD tumour and paired lung metastases.
a, b UMAP projection of comprehensively integrated clustering data from GPx2 KD primary tumour and paired lung mets using the integration pipeline in Seurat, unravelled 7 clusters involving four luminal-like (cluster 0, 1, 3, 4), one basal/mesenchymal-like (cluster 2); one macrophage-like (cluster 5) and one fibroblast-like (cluster 6). c, d Pseudotime time trajectories (d) of integrated clustering projected onto UMAP (c); the bifurcating line illustrates a branched trajectory from the root of one of the terminal nodes, which was arbitrarily set as cluster 2 or the most mesenchymal transcriptional node; colour changes (d) reflect pseudotime distance between clusters (basal/mesenchymal cluster 2 located at t = 0). e Gene expression levels of epithelial/luminal genes (Cdh1, Cldn3/7, Epcam), basal/mesenchymal (Krt14, Krt17) and stemness (Sox4, Sox9) across pseudotime distance between the clusters in primary GPx2 KD tumour vs lung mets are shown as curves; colours indicate individual clusters in UMAP projection over pseudotime distance. f Violin plots show relative expression of genes that were either epithelial/luminal (Cdh1, Epcam, Cldn3/7), basal/mesenchymal (Krt17,Vim, Snai1/2,Twist1), or stem-like (Notch1, Jag1, Sox4) in clusters from lung mets vs primary GPx2KD tumour, pointing to lung mets cluster 2 as the most hybrid (square).

