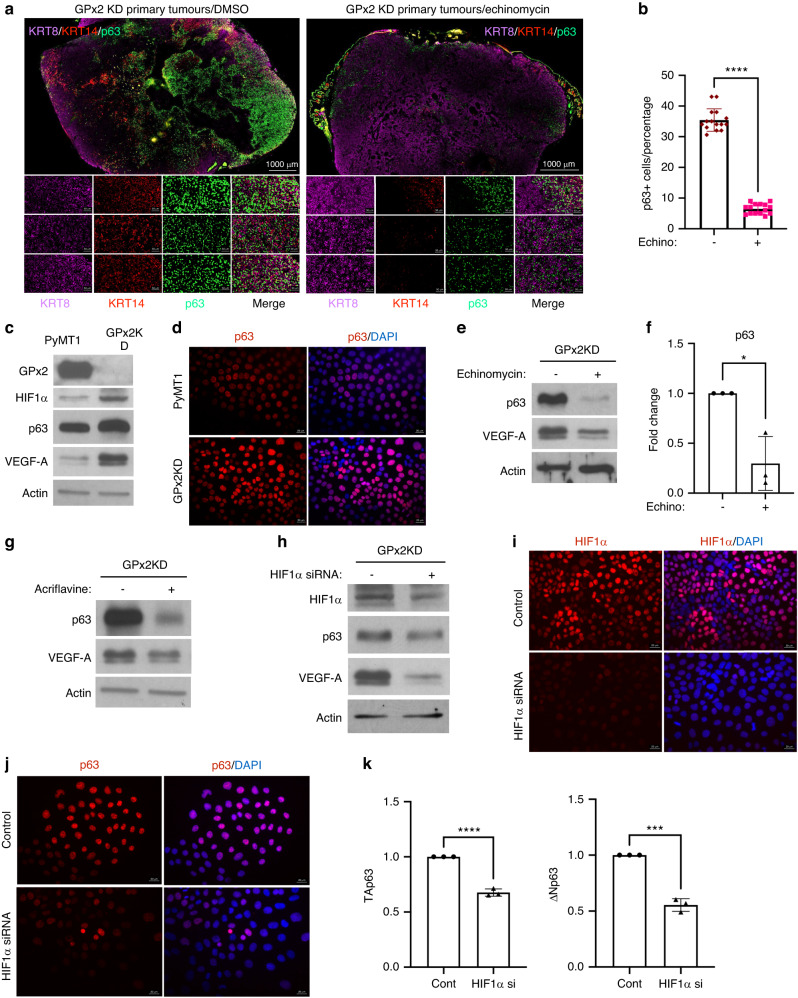
Fig. 7. HIF1α regulates the partial EMT and MET state via p63 upregulation.
a Co-staining of KRT8, KRT14, p63 showing individual and overlay staining in GPx2 KD tumours treated with DMSO (left panels) or echinomycin (n = 6) from 3 mice each. b Bar graphs display p63 expression levels in GPx2 KD tumours that were treated with echinomycin vs DMSO (n = 6 each); ****p < 0.0001. c Western blots of GPx2, HIF1α, p63, VEGF-A vs Actin in PyMT1/GPx2 KD and control PyMT1 cells. d p63 IF staining of control and GPx2 KD cells showing upregulation/nuclear localisation of p63 in GPx2KD relative cells (bottom). e, f Western blots of p63 and VEGF-A vs Actin in GPx2 KD cells treated with DMSO or echinomycin (e); graphs show relative densitometry of p63 protein in 3 replicas (f); Mean ± SEM; *p < 0.05. g, h Western blots of p63 and VEGF-A vs Actin in GPx2 KD cells that were treated −/+ Acriflavine (g); or −/+ HIF1α siRNA (h). i, j IF staining of HIF1α (i) and p63 (j) on GPx2 KD/control cells vs GPx2 KD/HIF1α siRNA cells. k Graphs show TA and ΔN p63 isoform RNA levels in control cells vs siRNA treated GPx2KD cells; Mean ± SEM; ***p < 0.001, ****p < 0.0001.

