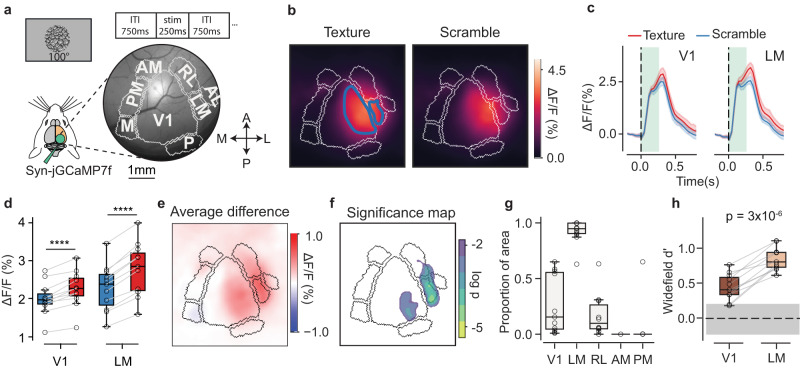
Fig. 2. Texture stimuli differentially modulate V1 and LM at the mesoscale level.
a Schematic plot of the widefield imaging setup. Top, an example of a texture image (100° diameter) and the stimulus presentation times. Right, a representative example of the right posterior cortex of a mouse with main-area borders (gray lines). V1, primary visual cortex; LM, secondary visual cortex (lateromedial); RL, rostrolateral; AL, anterolateral; AM, anteromedial; PM, posteromedial; M, medial area; P, posterior area. b Average GCaMP response (across all exemplars and repeats) to texture stimuli (left) and scramble stimuli (right) for a representative example mouse. The blue contours show the regions of interest (ROIs) retinotopically matching the visual stimuli in V1 and LM. c Average GCaMP responses from the retinotopically matched ROIs in V1 and LM for the same representative example shown in (b); texture–scramble difference, %ΔF/F, V1: 0.27% ± 0.04%; LM: 0.50% ± 0.03%. Textures in red, scrambles in blue. The green-shaded rectangles show the stimulus duration (250 ms); the vertical broken line indicates the time of stimulus onset. Shaded bands are 95% CIs (4 families x 20 exemplars). d, Responses across mice to textures and scrambles in V1 and LM ROIs; V1: scramble, ΔF/F: 2.0% ± 0.1% s.e., texture: 2.2% ± 0.1%; p = 3 × 10⁻⁵, two-sided paired t-test, n = 11 mice. For LM: scramble: 2.3 ± 0.2, texture: 2.8 ± 0.2; p = 1 × 10⁻⁶. Color code as in (c). Box plots indicate the median with a horizontal bar; the box height denotes the inter-quartile range (IQR, 1st and 3rd quartile) and the whiskers extend by 1.5 x IQR. e, The difference between the texture–scramble images shown in (b). f, The regions with a statistically significant response difference shown in (e) – the logarithm of the p-values from a two-sided t-test; colored regions for p < 0.01. g, Proportion of pixels in each visual area (within the retinotopically identified ROIs) modulated by the textures relative to the scrambles (n = 11 mice, empty dots); V1: 0.27 ± 0.08 s.e., LM: 0.92 ± 0.03; RL: 0.17 ± 0.06; AM: not detected; PM: 0.06 ± 0.06. Box plots as in (d). h Discriminability measure (d’) between textures and scrambles from ΔF/F (%) responses within the same ROIs used for (g). The gray horizontal band corresponds to a null d’ distribution derived from pre-stimulus activity. Each dot is one animal, connecting lines for the same-mouse data. The horizontal broken line indicates the mean of the null distribution; p-value from two-sided paired t-test. For statistical significance in this and other figures, * is for p < 10−2, ** p < 10−3, *** p < 10−4. **** p < 10−5. Box plots as in d. Source data are provided as a Source Data file.

