FIGURE 3.

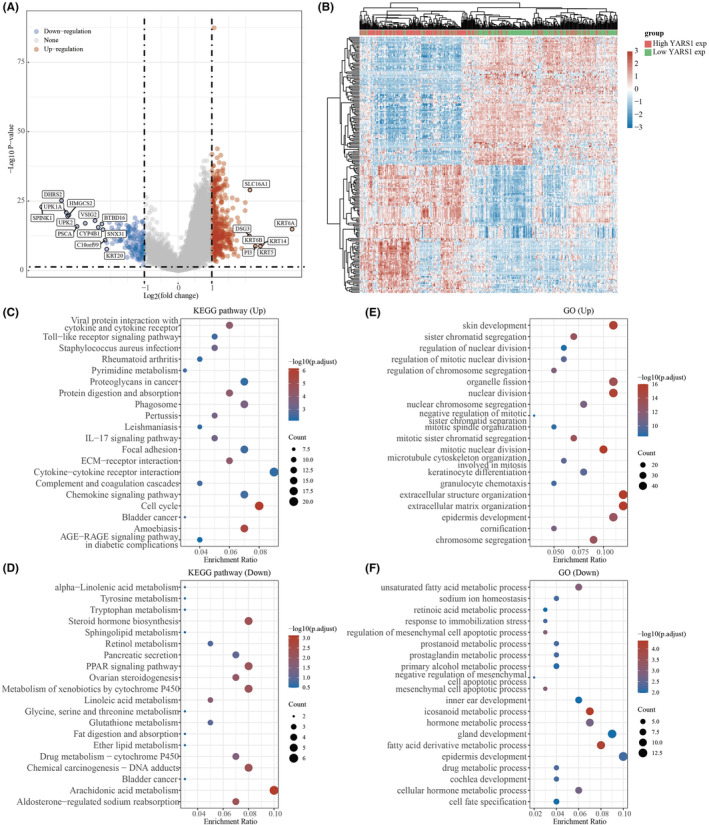
KEGG and GO analyses of potential functions of YARS1. (A) Volcano maps for YARS1 difference analysis. (B) Heat map of YARS1‐related differential gene expression. (C, D) KEGG and GO analysis of YARS1‐related upregulated genes. (E, F) KEGG and GO analysis of YARS1‐related downregulated genes.
