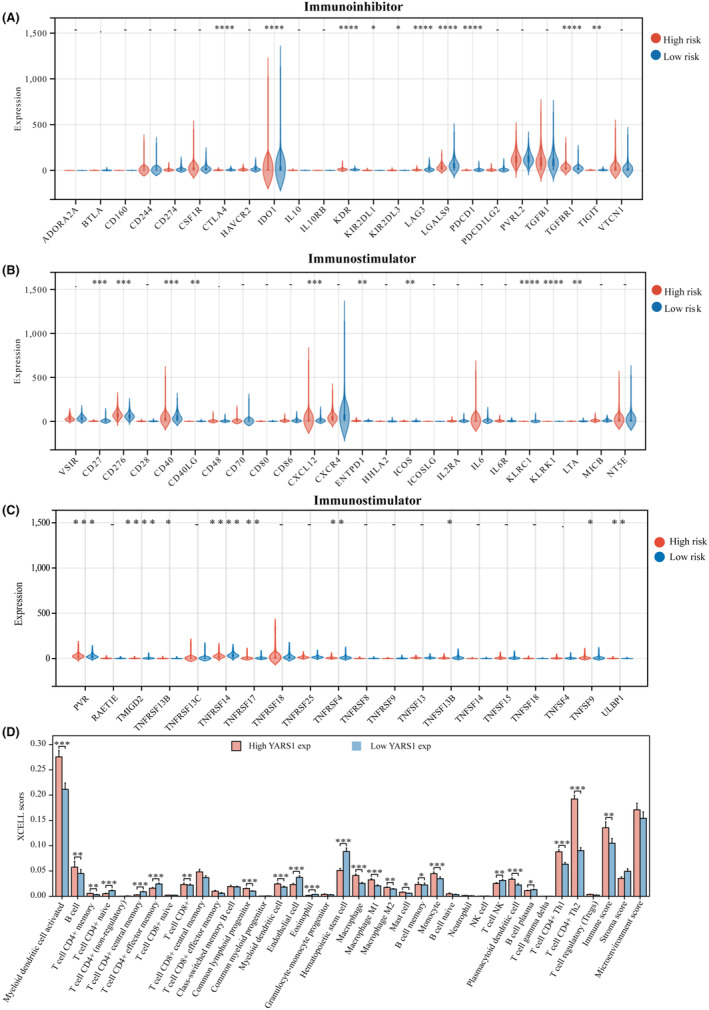
FIGURE 6.

Correlation between prognostic models and immunostimulator and immunoinhibitor. (A–C) Correlation between prognostic models and immunostimulator and immunoinhibitory. (D) Correlation between YARS1 expression and immune cells. *p < .05, **p < .01, ***p < .001, ****p < .0001.
