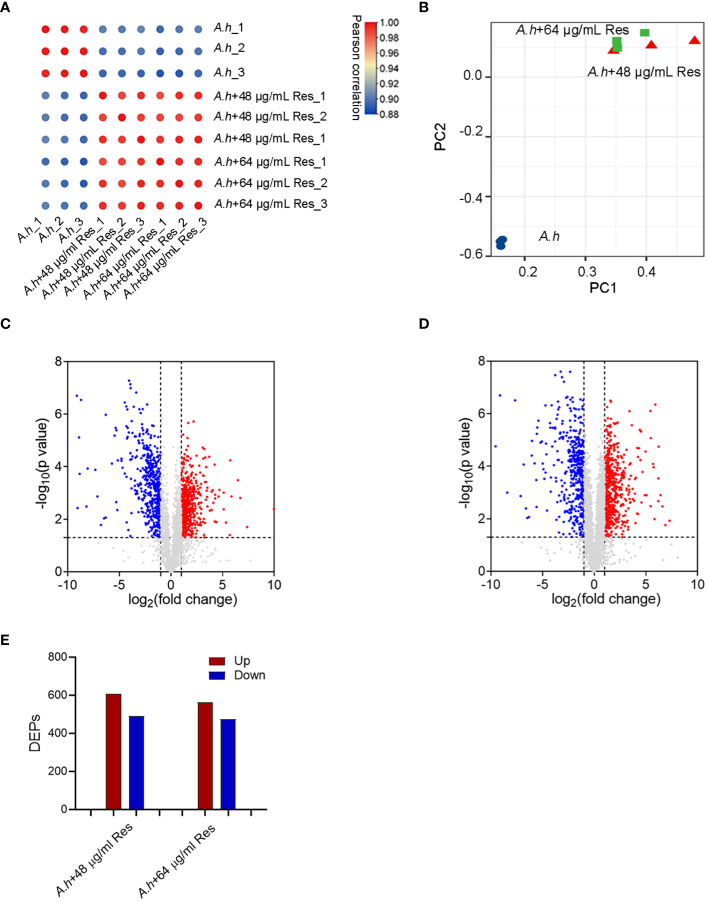
Figure 2.
Quantitative proteomics analysis of DEPs among A. hydrophilaI with or without serials dose of resveratrol treatments. (A) Correlation analysis of protein abundance; (B) Principal component analysis (PCA). Different colors represent different samples and three dots of the same color represent three repeats; (C, D) The volcano plots of the significantly DEPs treated with 48, 64 μg/mL resveratrol, respectively. Each dot represents a protein, blue dot represents down regulated expression, red dot represents up regulated expression; (E) Histogram of numbers of DEPs in each comparison groups. The blue and red histogram represents down and up regulated expression, respectively.

