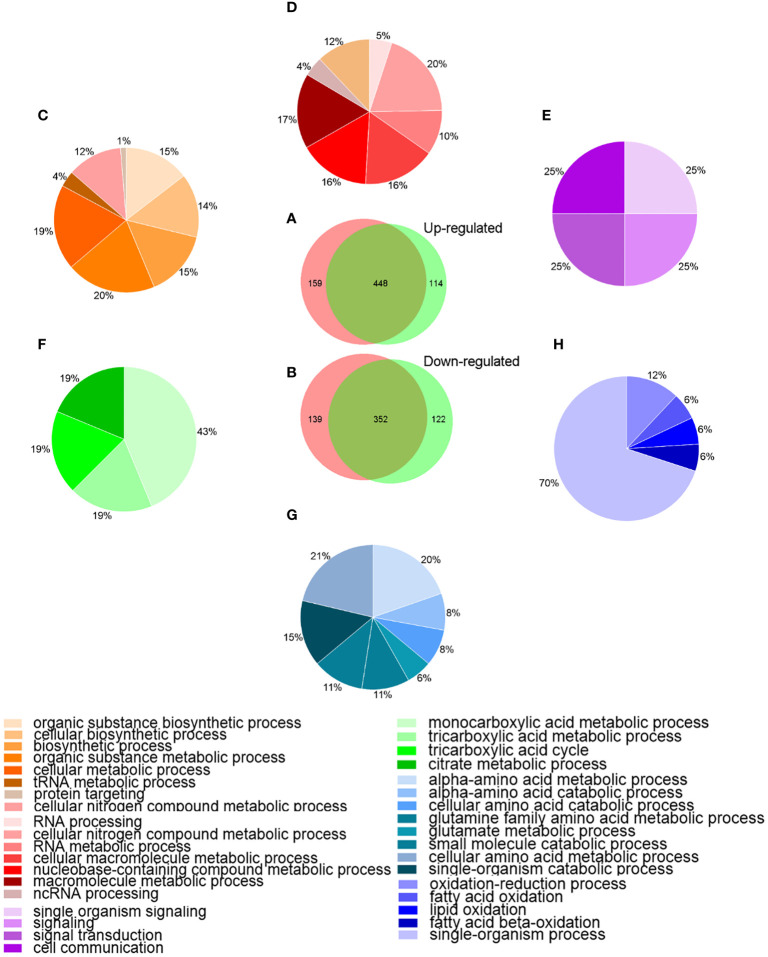
Figure 3.
Venn-diagram and GO analysis of DEPs in A. hydrophila under 48, 64 μg/mL resveratrol treatment. (A, B) Venn-diagram showing the overlapping numbers of up and down-regulated proteins between A.h+48 μg/mL Res vs. A.h, and A.h+64 μg/mL Res vs. A.h group, respectively; (C–E) Biological processes related to the functional enrichment of up-regulated proteins among unique in 48 μg/mL Res group, overlap in both groups, and unique in 64 μg/mL Res group, respectively; (F–H) Biological processes related functional enrichment of down-regulated proteins among unique in 48 μg/mL Res group, overlap in both group, and unique in 48 μg/mL Res group, respectively. Different colors stand for different biological processes related to functional enrichments and were presented in those percentage pie charts accordingly.

