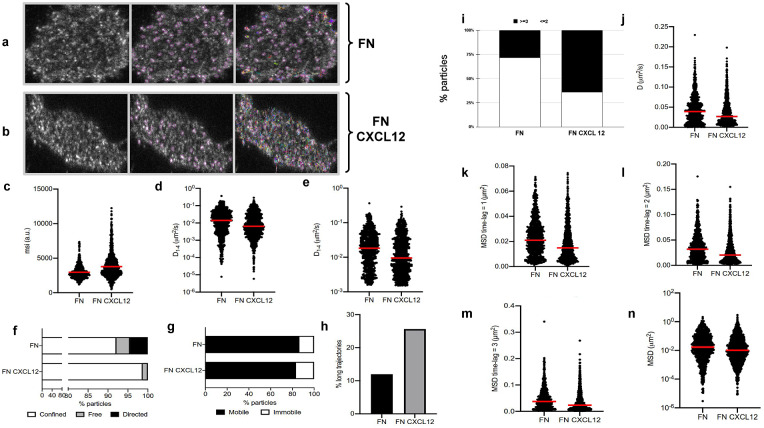
Figure 5.
Application of TrackAnalyzer to track CXCR4-AcGFPm in JK CXCR4
 cells electroporated with CXCR4-AcGFPm. (a-b) Images of Jurkat CXCR4
 cells electroporated with CXCR4-AcGFPm on fibronectin (FN)- (a) and FN + CXCL12-coated coverslips (b). Scale bar, 5 μm. (c–f) Tracking results from TrackAnalyzer (741 particles in 18 cells on FN and 1,209 particles in 14 cells on FN + CXCL12). (c) Mean spot intensity (MSI, arbitrary units, a.u.) from individual CXCR4-AcGFPm trajectories. The mean is indicated (red). Short-time lag diffusion coefficients (
 ) of all (d) and mobile (e) single trajectories. The median is indicated (red). (***p
 0.001, ****p
 0.0001, Welch’s t-test). (f) Percentage of confined, free and directed CXCR4-AcGFPm particles at the cell membrane using the slope of MSS. (g) Percentage of mobile and immobile CXCR4-AcGFPm particles at the cell membrane. (h) Percentage of long trajectories of CXCR4-AcGFPm particles at the cell membrane. (i) Frequency of CXCR4-AcGFP particles containing the same number of receptors [monomers plus dimers (2)
 or nanoclusters (3)
 in cells, calculated from MSI values of each particle as compared with the MSI value of monomeric CD86-AcGFP. (j) Diffusion coefficients (D) of single trajectories. The median is indicated (red). (k) Mean Squared Displacement (MSD) of single trajectories using the first-time lag. The median is indicated (red). (l) Mean Squared Displacement (MSD) of single trajectories using the second time lag. The median is indicated (red). (m) Mean Squared Displacement (MSD) of single trajectories using third time-lag. The median is indicated (red). (n) Mean Squared Displacement (MSD) of single trajectories using more than three time-lags. The median is indicated (red).

