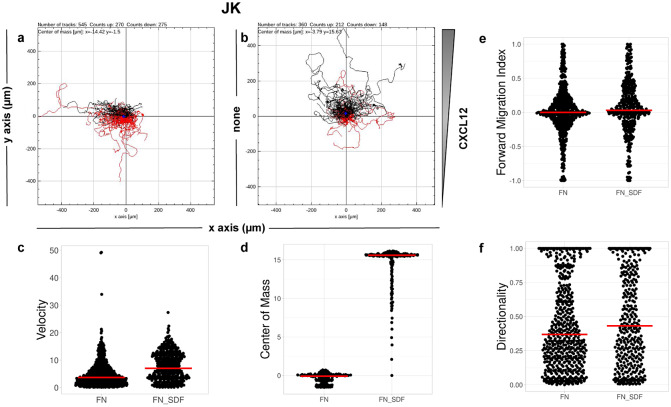
Figure 6.
Migration of JK cells in response to a CXCL12 gradient. (a,b) Representative spider plots showing the trajectories of tracked cells migrating along the gradient (black) or moving in the opposite direction (red). Black and red dots in the plots represent the final position of each single-tracked cell. The grey triangle indicates CXCL12 gradient. Quantification of the velocity (c), center of mass (d), forward migration index (e), and directionality (f) of experiments performed.

