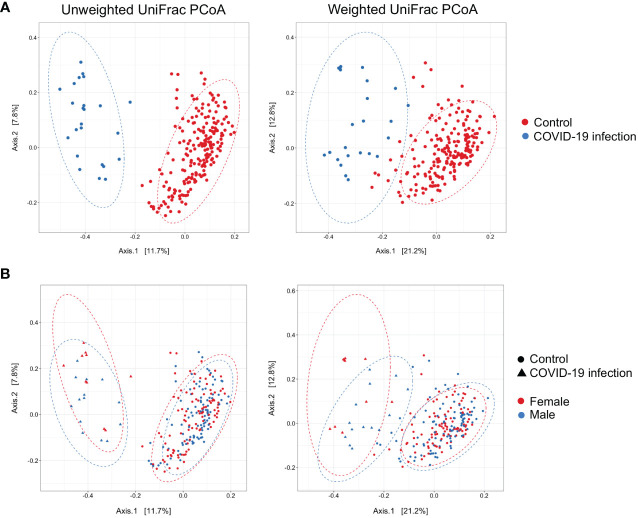
Figure 2.
(A) Principal Coordinate Analysis (PCoA) on unweighted and weighted UniFrac distance metric calculated on COVID-19 patients (n = 24, blue dots) and healthy controls (n = 201, red dots). Each sample is represented by a dot. Axis 1 explained 11.7% and 21.2% of the variation observed, while Axis 2 explained 7.8% and 12.8% of the variation, in the left and right graph, respectively; PERMANOVA on weighted and unweighted UniFrac Pr(> F) = 0.001, beta-dispersion = 0.001. (B) Addition of the sex distinction layer to the same graphical display; PERMANOVA on weighted UniFrac Pr(> F) = 0.012, beta-dispersion = n.s.

