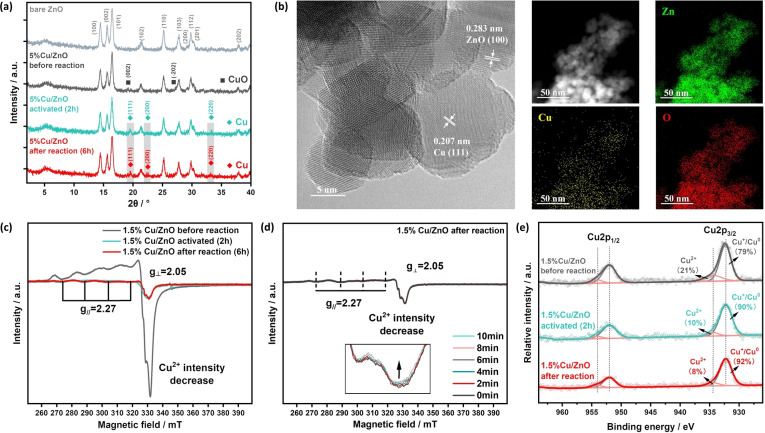
Figure 3.
Characterization of photocatalysts. (a) XRD patterns of bare ZnO, 5 %Cu/ZnO samples (before, activated and after reaction). (b) TEM and EDS mapping image of Cu/ZnO after reaction sample. (c) EPR spectra of 1.5 % Cu/ZnO samples (before, activated and after reaction). (d) In situ EPR spectra of 1.5 % Cu/ZnO after reaction sample. (e) Deconvolution of XPS spectra in the Cu 2p3/2 region for 1.5 % Cu/ZnO samples (before, activated and after reaction).

