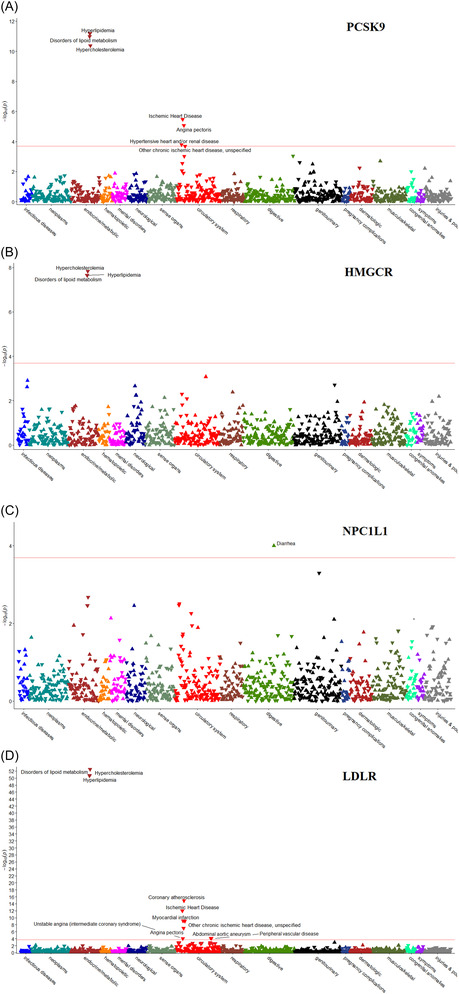
FIGURE 1.

Manhattan plots for the phenome‐wide association analyses using LDL‐cholesterol‐lowering genetic risk scores: (A) PCSK9, (B) HMGCR, (C) NPC1L1 and (D) LDLR. For each LDL‐C‐GRS‐outcome association, a logistic model was used adjusting for age, sex, 40 principal components and SNP array. A higher LDL‐C‐lowering genetic risk score indicates lower serum LDL‐C levels. Red line: FDR threshold P = 2.0 × 10⁻⁴; downward triangles: OR < 1; upward triangles: OR ≥ 1.
