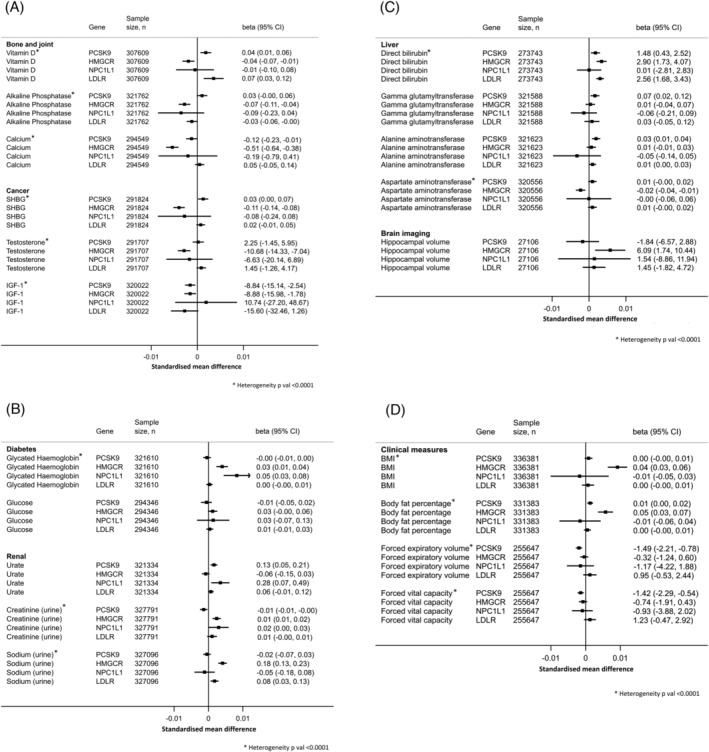
FIGURE 3.

Forest plots for the Mendelian randomization analyses on the 20 significant LDL‐C lowering–biomarker associations, which pass the FDR threshold, using the LDL‐C‐lowering genetic instruments. Analyses using inverse‐variance weighted Mendelian randomization (IVWMR) are shown. Graphs are presented as standardized mean difference in biomarker levels for each GRS (to compare the estimates with the same scale) and estimates shown on the right are absolute beta values in their respective units (beta 95% CI) per 1 mg/dL lower LDL‐C. FDR threshold: P = 1.3 × 10⁻². (A) Absolute beta values are presented in nmol/L (25(OH)D); IU/L (alkaline phosphatase); μmol (calcium); nmol/L (SHBG); pmol/L (testosterone) or pmol/L (IGF‐1) per 1 mg/dL lower LDL‐C. (B) Absolute beta values are presented in mmol/mol (HbA1c); mg/dL (glucose); μmol/L (urate); mmol/L (urine creatinine) or mmol/L (urine sodium) per 1 mg/dL lower LDL‐C. (C) Absolute beta values are presented in nmol/L (direct bilirubin); U/L (gamma glutamyltransferase); U/L (alanine aminotransferase); U/L (aspartate aminotransferase) or mm3 (hippocampal volume) per 1 mg/dL lower LDL‐C. (D) Absolute beta values are presented in kg/m2 (BMI); % (body fat percentage); mL (FEV) or mL (FVC) per 1 mg/dL lower LDL‐C.
