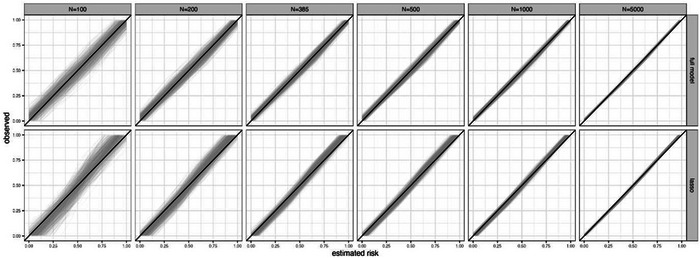
FIGURE 2.

Each plot shows instability of calibration curves for 1000 example models developed using a particular sample size (100, 200, 385, 500, 1000, or 5000) when each model is applied to the same population of 100,000 individuals: each example model was produced from a logistic regression (LR) with a LASSO penalty fitted to a different random sample of individuals from a population with a true overall risk of 0.5, considering 1 genuine predictor (X∼N(0,4)) and 10 noise variables (Z1, …, Z10 ∼ N(0,1)).
