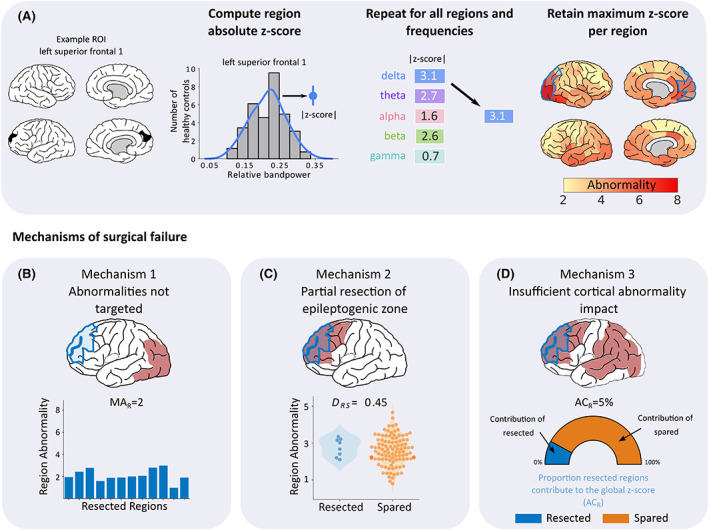
FIGURE 2.

Processing pipeline for patient abnormality mapping and derivation of the three surgical failure mechanisms. (A) Patient abnormality maps were generated using control data as a baseline (top panel). For each region and frequency, the band‐power contribution was z‐scored using control data as a reference. Within each region, frequency abnormality dimensions were reduced by retaining only the maximum absolute abnormality. This process was repeated for all regions to create patient‐specific maps of band‐power abnormalities. Three mechanisms were proposed that could underlie surgical failure (bottom row). (B) First, failure to resect abnormalities could lead to poor surgical outcome. This mechanism was quantified using the average abnormality of the resected tissue (MAR), with lower values hypothesized to cause surgical failure. (C) Second, we hypothesized that a partial resection to the epileptogenic zone regardless of whether abnormalities are resected, could lead to surgical failure. To quantify this mechanism, we used distinguishability between resected and spared tissue (D RS) scores to measure the separability of the resected and spared tissue based on abnormality values. D RS is identical to the area under the curve (AUC). Scores close to 0 indicate that the abnormalities of resected tissue are greater in magnitude than abnormalities of spared tissue. Conversely, D RS scores close to 1 indicate that the spared tissue is more abnormal relative to the resected tissue. (D) Finally, insufficient cortical abnormality impact could also contribute to a poor surgical outcome. We quantified this mechanism using ACR, defined as the abnormality contribution of resected tissue, relative to the global abnormality. If abnormalities are widespread, the overall cortical abnormality is unlikely to be sufficiently altered by a localized resection, potentially leading to surgical failure.
