Fig. 3.

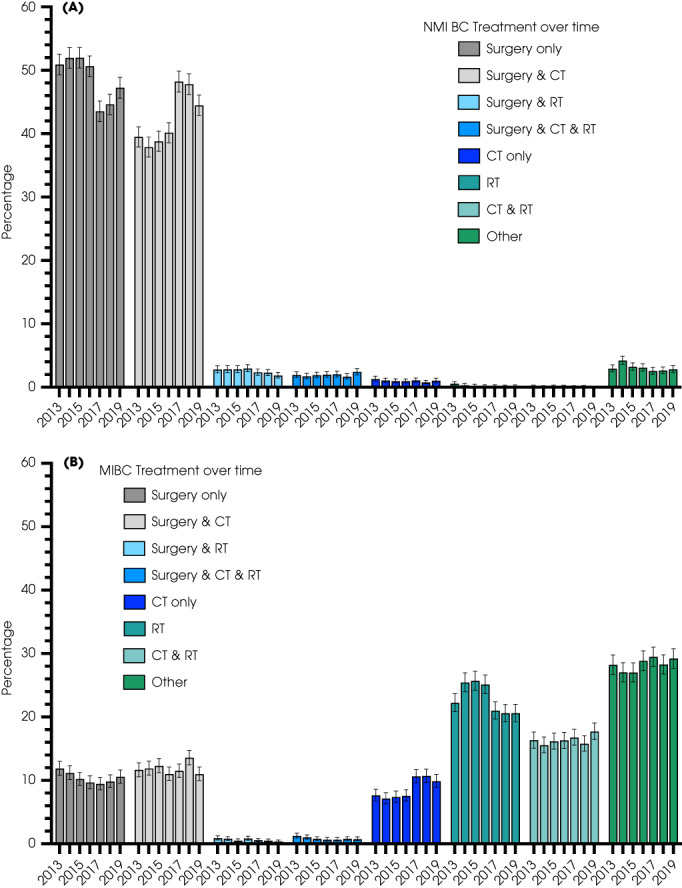
Distribution of individual treatment(s) for (A) 25 268 pT1 NMIBCs and (B) 23 373 MIBCs from 2013 to 2018. CT, chemotherapy; RT, radiotherapy.

Distribution of individual treatment(s) for (A) 25 268 pT1 NMIBCs and (B) 23 373 MIBCs from 2013 to 2018. CT, chemotherapy; RT, radiotherapy.