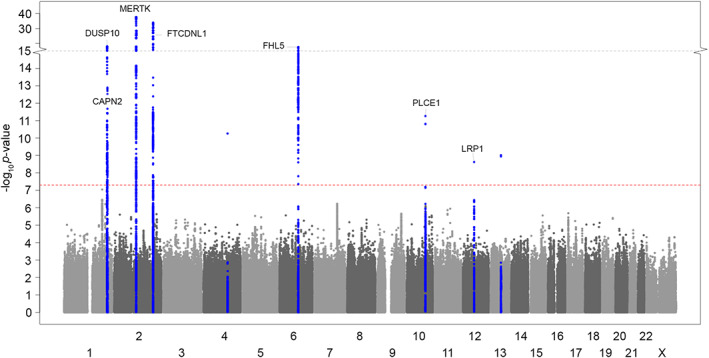
FIGURE 3.

Manhattan plot showing genomewide significant loci associated with cluster headache in trans‐ancestry meta‐analysis (4,777 cases and 31,575 controls). The horizontal axis shows the chromosomal position and the vertical axis shows the significance (−log10 p value) of tested markers. Each dot represents a genetic variant. The threshold for genomewide significance (p < 5 × 10⁻⁸) is indicated by a red dotted line, and genomewide significance loci are shown in blue. Three genomewide significant variants (rs9307511 on chr4 and rs338106 and rs747974 on chr 13) were considered spurious associations as they lacked a supporting LD structure, were driven by the East Asian cohort alone, and were previously interpreted as being spurious associations in this cohort. 8 LD = linkage disequilibrium. [Color figure can be viewed at www.annalsofneurology.org]
