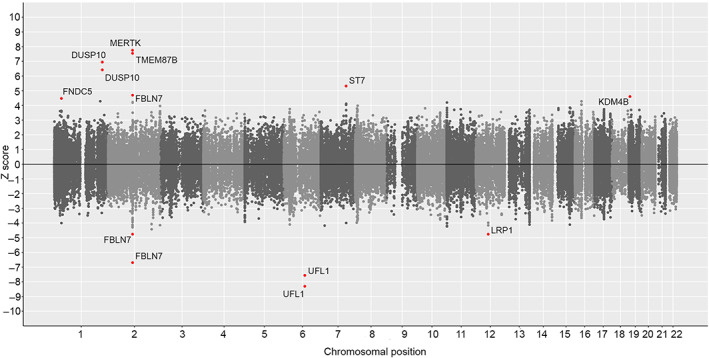
FIGURE 4.

Miami plot of genetically driven DNA methylation genes in cluster headache. Computational prediction of genetically driven CpG methylation associated with cluster headache, using MetaMeth. Genes annotated to significant CpGs are shown (FDR‐corrected p value < 0.05). Horizontal axis shows the chromosomal position and the vertical axis shows significance (−log10 p value). The top panel shows predicted hypermethylation, whereas the bottom panel shows predicted hypomethylation. CpG = 5′‐C‐phosphate‐G‐3′; FDR = false discovery rate. [Color figure can be viewed at www.annalsofneurology.org]
