
Figure 2.
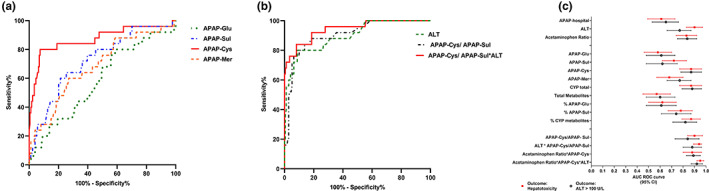
ROC analysis of the ability of APAP metabolite concentration, ALT and metabolite ratios to predict hepatotoxicity. ROC analysis of the ability of (a) initial APAP metabolite concentrations (b) ALT, APAP‐Cys/APAP‐Sul and APAP‐Cys/APAP‐Sul*ALT (c) Forest plot of AUC‐ROC to predict hepatotoxicity (ALT >1,000 U/L) (squares) and ALT >100 U/L (open circles). ALT, alanine aminotransferase; APAP, acetaminophen; APAP‐Cys, acetaminophen‐cysteine; APAP‐Glu, acetaminophen‐glucuronide; APAP‐Mer, acetaminophen‐mercapturate; APAP‐Sul, acetaminophen‐sulfate; AUC, area under the curve; CI, confidence interval; ROC, receiver operating characteristic curve.