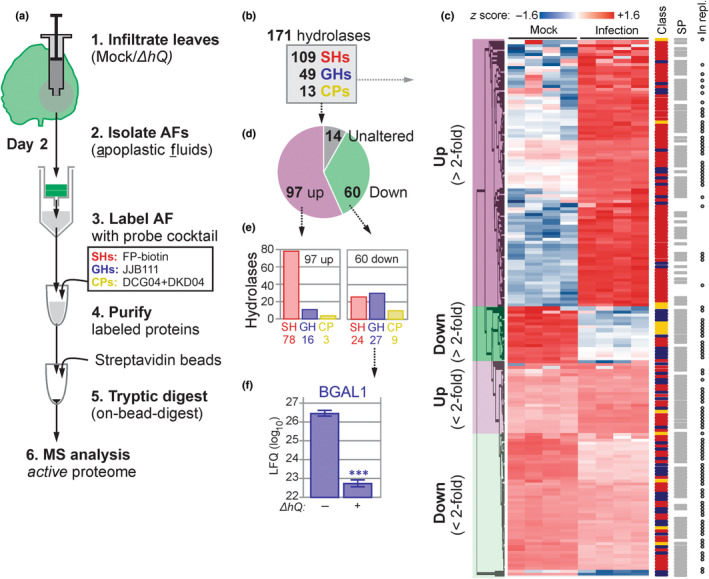
Fig. 2.

Activity‐based proteomics displays hydrolase activity dynamics upon infection. (a) Experimental procedure. Nicotiana benthamiana plants were infiltrated with PtoDC3000(ΔhQ) or water (Mock) and apoplastic fluid (AF) was collected at 2‐d postinfection (2 dpi). AFs were labelled with a cocktail activity‐based probes targeting active serine hydrolases (SHs, red), glycosyl hydrolases (GHs, blue) and cysteine proteases (CPs, yellow). Labelled proteins were purified and identified by mass spectrometry (MS) for n = 4 replicates. (b) Classification of 171 robustly detected labelled hydrolases. (c) Heatmap of the 171 detected active hydrolases detected by activity‐based proteomics (experiment ACE136), grouped by category (left) and annotated for being SH/GH/CP; having a SignalP‐predicted signal peptide (SP); and for being detected in an independent replicate MS experiment (ACE236) (right). (d) Summary of the detected differential active hydrolases showing statistically significant up or downregulation upon bacterial infection. (e) Summary of the numbers of active hydrolases belonging to each class that are up or downregulated. (f) β‐galactosidase‐1 (BGAL1) labelling is significantly downregulated upon infection. The label‐free quantitation intensities for this positive control were extracted from this dataset (ACE_0236). Error bars represent standard error from n = 4 biological replicates. ***, P < 0.001 (Students' t‐test).
