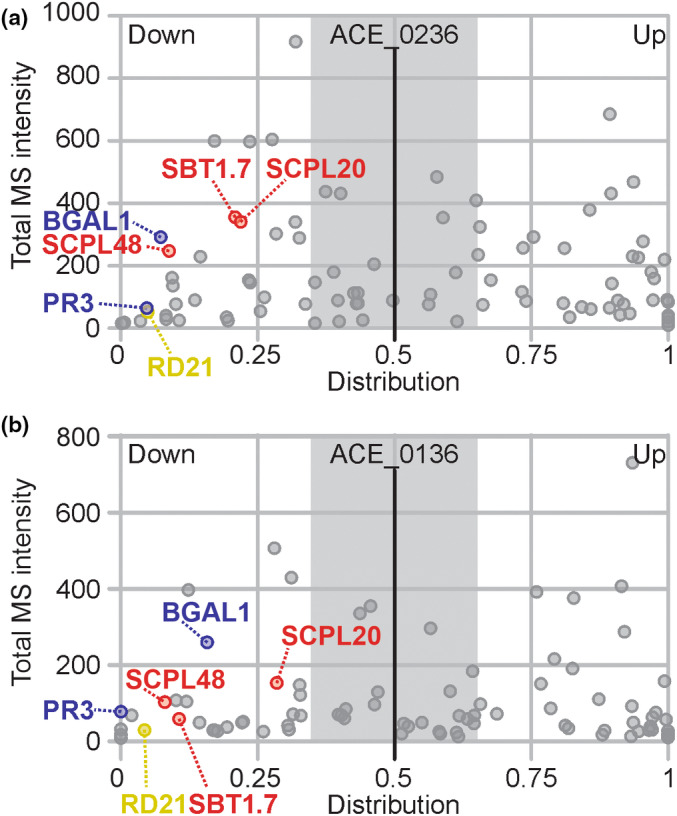
Fig. 3.

Several secreted hydrolases are consistently suppressed during infection. Distribution graphs of the active proteome from two independent experiments. Data derived from Fig. 2 (experiment ACE_0236) (a) were compared with a replicate experiment (ACE_0136, Supporting Information Fig. S3) (b) and used to select consistently suppressed hydrolases. Total mass spectrometry (MS)/MS spectra for mock and infected samples were combined and plotted against the distribution of each protein in mock and infected samples. The distribution was calculated as label‐free quantitation (LFQ)infected/(LFQmock + LFQinfected). Proteins are represented as dots, and only proteins showing the same behaviour in both biological replicates are shown. Six hydrolases (NbSBT1.7a, NbSCPL20, NbSCPL48, NbPR3, NbRD21 and NbBGAL1) are indicated and coloured red, blue and yellow according to hydrolase class (SH, GH and CP, respectively).
