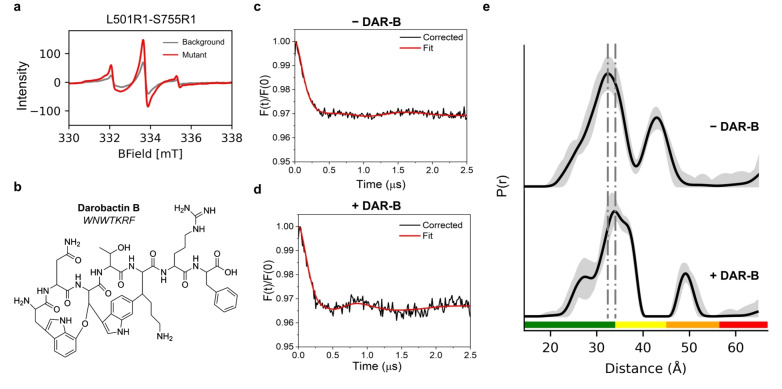
Figure 2.
Darobactin B (DAR‐B) alters the BAM conformational ensemble in whole cells. a) Xband room temperature cwEPR spectra of MTSSL labelled cells containing the L501R1‐S755R1 spin pair (red). Background signal from labelled cells expressing Cys‐free BAM is also shown (grey). b) Chemical structure and peptide formula of Darobactin‐B (DAR‐B). c) Experimental background‐corrected (black line) and fitted (red line) PELDOR traces for MTSSL labelled BAM L501R1‐S755R1, measured in cells. d) Experimental background‐corrected PELDOR traces for MTSSL labelled BAM L501R1‐S755R1, measured in cells after incubation with DAR‐B. For (c) and (d) PELDOR traces from MTSSL labelled cells expressing Cys‐free BAM under the same conditions (−/+DAR‐B respectively) were used for experimental background‐correction. These are shown in Figure S5a. Additional background correction analysis is presented in Figures S6 and S7 and discussed in Methods. PELDOR traces of single Cys BAM variants (L501R1 and S755R1), using 1 to 1 weighting in DeerAnalysis and corresponding experimental background corrected data (+DAR‐B) are also shown in Figure S6c–f, yielding similar distance distributions to Cys‐free BAM background. e) PELDOR‐derived distance distributions for BAM L501R1‐S755R1 +/−DAR‐B, showing the shifting of the distribution upon addition of the antibiotic. For PELDOR, the mean distance (black) and 2σ confidence intervals (shaded grey areas) show the mean ±2σ confidence intervals of the measured distributions calculated using the validation tool in DeerAnalysis (Methods). Traffic light indicates reliability of PELDOR distribution: (green, shape reliable; yellow, mean and width reliable; orange, mean reliable; red, no quantification possible). Dashed lines indicate positions of peaks in PELDOR distance distributions. Y‐axis for distance distributions indicate the probability density P(r).

