Figure 3.
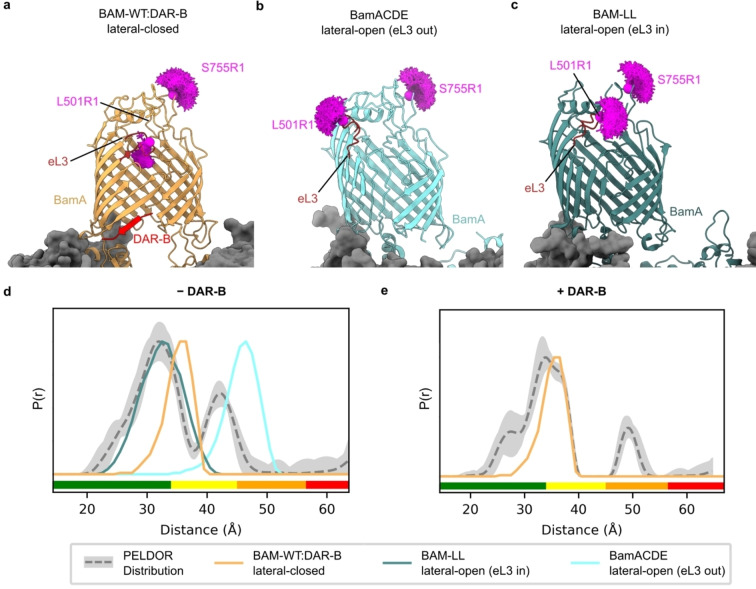
Determination of the conformation of BAM in the presence and absence of DAR‐B. a) Lateral‐closed conformation of BAM in complex with DAR‐B determined here using cryoEM (PDB: 8BVQ), with eL3 pointing into the barrel (orange). b) Lateral‐open conformation of BamACDE determined using X‐ray crystallography (PDB: 5D0Q) [5] with eL3 pointing out of the barrel (light blue). This structure is used for modelling the distance between L501R1 (which lies in eL3) and S755R1, as it has clear density for L501, while this residue, along with others in eL3 are absent in other lateral‐open BAM structures, including the cryoEM structure of apo‐BAM determined in this study (Figure S14). c) Lateral‐open like conformation of a lid‐locked BAM (PDB: 7NBX) [7] with eL3 pointing into the barrel (dark green). Predicted MTSSL ensembles for L501R1‐S755R1 are indicated for each structure (magenta). d) Comparison of observed PELDOR distribution for L501R1‐S755R1 −DAR‐B (grey) to the predicted distance distribution for all structures in (a)–(c). The distribution is consistent with a mixture of lateral‐open (eL3 in) and lateral‐closed conformations. e) Comparison of observed PELDOR distance distribution for L501R1‐S755R1 +DAR‐B (grey) to the predicted distance distribution in silico for the lateral‐closed BAM‐WT : DAR‐B structure, showing good agreement of this prediction with the observed distribution. For PELDOR, the mean distance (dashed grey) and 2σ confidence interval (light grey) (defines as in Figure 2) are shown. Traffic light indicates reliability of PELDOR distribution: (green, shape reliable; yellow, mean and width reliable; orange, mean reliable; red, no quantification possible). Y‐axis for distance distributions indicate the probability density P(r).

