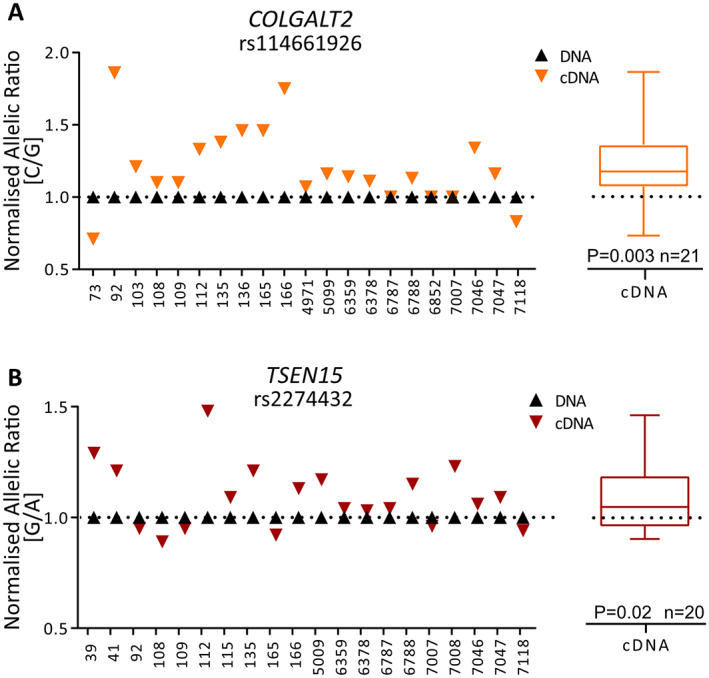
Figure 2.

Allelic expression imbalance analysis of COLGALT2 and TSEN15 in human arthroplasty cartilage samples. A, Allelic ratios for COLGALT2 transcript single‐nucleotide polymorphism (SNP) rs114661926 (C/G; C = osteoarthritis [OA] risk allele). B, Allelic ratios for TSEN15 transcript SNP rs2274432 (G/A; G = OA risk allele). Numbers on x‐axes indicate patient sample identification numbers. Symbols in graphs represent the mean of 3 technical replicates. Mean complementary DNA (cDNA) values measured across all samples are shown as box plots. Each box represents the interquartile range. Lines inside the box represent the median. Whiskers represent the minimum and maximum values. Dashed lines represent the allele ratios in DNA. P values were calculated using Wilcoxon's matched pairs signed rank test. Color figure can be viewed in the online issue, which is available at http://onlinelibrary.wiley.com/doi/10.1002/art.42427/abstract.
