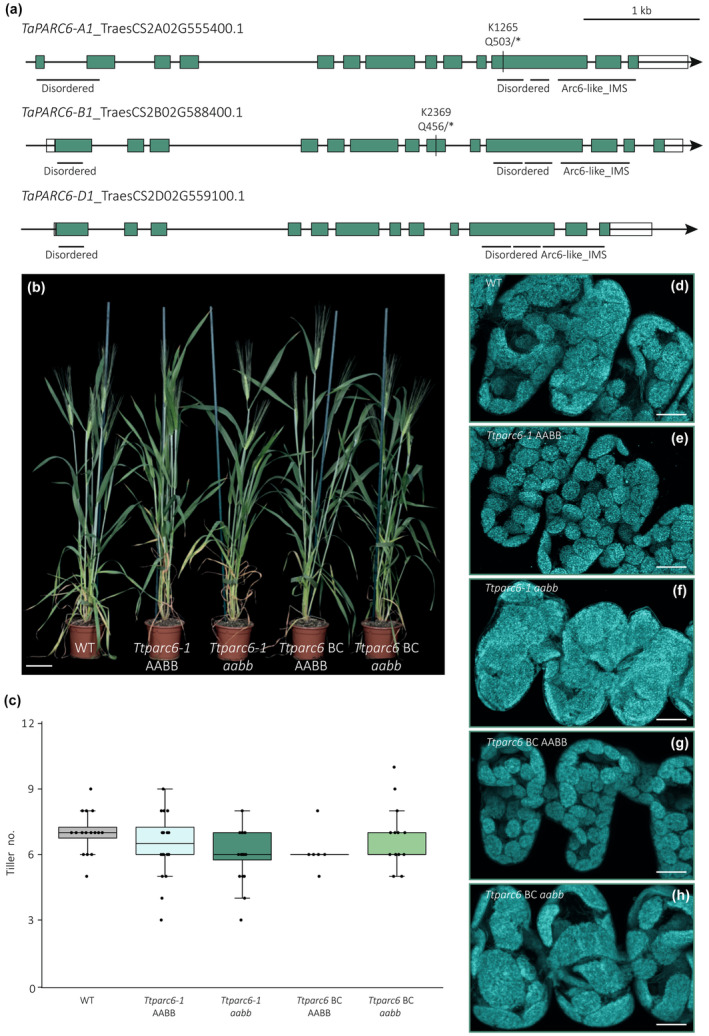
Fig. 1.

Growth phenotype of Ttparc6 durum wheat mutants. (a) Schematic illustration of the gene models for the primary transcripts of TaPARC6‐A1, TaPARC6‐B1 and TaPARC6‐D1 in bread wheat. Exons are represented as teal boxes and untranslated regions (UTRs) are represented as white boxes. Mutation sites in K1265 and K2369 are indicated by black lines and the resulting amino acid to stop codon (*) substitutions are annotated. Regions encoding domains are indicated by black horizontal lines (IMS, intermembrane space). (b) Photograph of 8‐wk‐old Ttparc6 double mutant (Ttparc6‐1 aabb), the corresponding wild‐type (WT) segregant (Ttparc6‐1 AABB), Ttparc6 backcrossed double mutant (Ttparc6 BC aabb), the corresponding WT segregant (Ttparc6 BC AABB) and WT wheat (cv Kronos) plants. Bar, 10 cm. (c) The number of tillers per plant (Tiller no.) of mature Ttparc6 mutant plants. The top and the bottom of the box represent the lower and upper quartiles, respectively, and the band inside the box represents the median. The ends of the whiskers represent values within 1.5× of the interquartile range. Outliers are values outside 1.5× the interquartile range. There is no significant difference between the lines as determined by Kruskal–Wallis one‐way analysis of variance (ANOVA) on ranks: P = 0.097. (d–h) Images of mesophyll‐cell chloroplasts in the third leaf of Ttparc6 mutant seedlings. Images were acquired using confocal microscopy and are Z‐projections of image stacks. Chlorophyll autofluorescence of the chloroplasts is shown in cyan. Bar, 10 μm.
