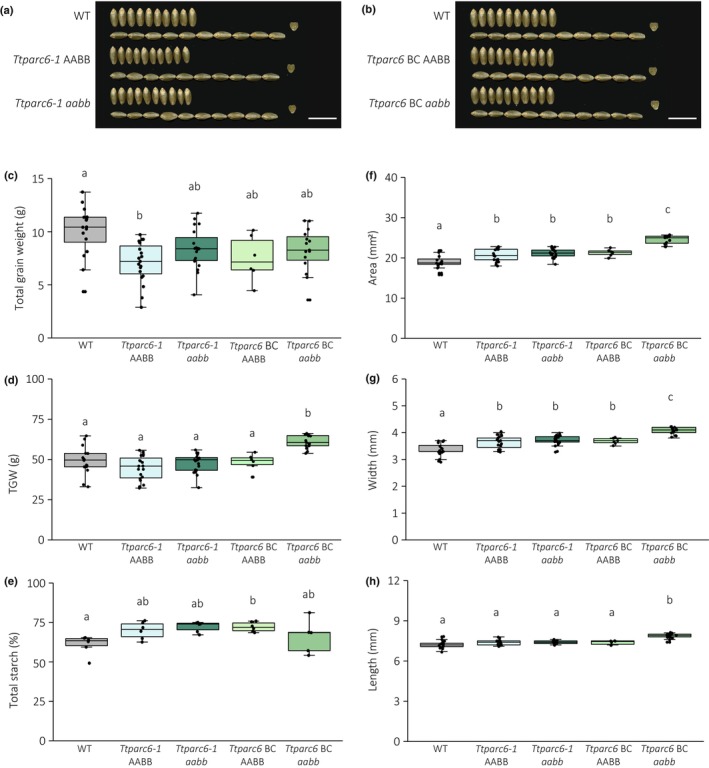
Fig. 2.

Seed phenotype of Ttparc6 durum wheat mutants. (a, b) Photographs of 10 representative mature grains per genotype. Note that the same wild‐type (WT) grains were used in both panels. Bar, 1 cm. (c) Total grain weight harvested per plant (in g). Dots represent the total grain weight of individual plants (n = 6–19) per genotype. Significant differences under a one‐way analysis of variance (ANOVA), and all pairwise multiple comparison procedures (Tukey's test) are indicated with different letters (P ≤ 0.002). (d) Thousand‐grain weight (TGW) (in g). Dots represent calculated TGW of individual plants (n = 6–19) per genotype. Significant differences under a one‐way ANOVA, and all pairwise multiple comparison procedures (Tukey's test) are indicated with different letters (P ≤ 0.001). (e) Total starch content as % (w/w). Three technical replicates of two biological replicates per genotype. Significant difference between the genotypes under a Kruskal–Wallis one‐way ANOVA on ranks and all pairwise multiple comparison procedures (Tukey's test) are indicated with different letters (P ≤ 0.041). (f–h) Grain size parameters measured as seed area (f), width (g) and length (h). Dots represent the average for each parameter calculated from grains from individual plants (n = 6–19) per genotype. Significant differences under a one‐way ANOVA (f, g) or a Kruskal–Wallis one‐way ANOVA on ranks (h), and all pairwise multiple comparison procedures (Tukey's test) are indicated with different letters (P ≤ 0.001). For all boxplots, the bottom and top of the box represent the lower and upper quartiles, respectively, and the band inside the box represents the median. The ends of the whiskers represent values within 1.5× of the interquartile range, whereas values outside are outliers.
