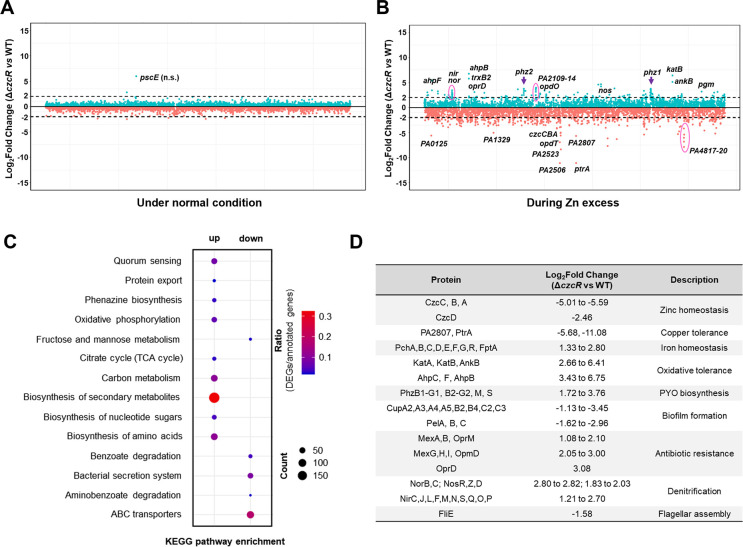
Fig 1.
CzcS/CzcR modulates global gene expression during Zn excess. (A and B) Genome-wide transcriptomic profiles of the PAO1 WT strain and the ΔczcR mutant when they were cultured under the normal condition (A) or with the supplementation of 0.5 mM ZnSO4 (B). Green dots were the genes upregulated in the ΔczcR mutant, and orange dots were the genes downregulated in the ΔczcR mutant. The black dot lines represented 2-Log2Fold expression changes. Genes with dramatic differences in expression were selectively labeled. (C) KEGG pathway enrichment of genes that were upregulated and downregulated in the ΔczcR mutant. The size of the dot represented the number of genes in the pathways. (D) Representative upregulated and downregulated genes in the ΔczcR mutant with different biological functions were displayed.

