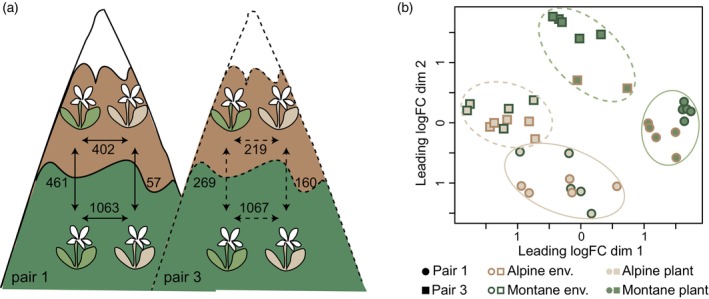
Figure 3.

Study design and summary of its results.
(a) Setup of the reciprocal transplantations between alpine (symbolized with brown areas of the mountains) and montane sites (shown with dark green areas). Brown plants represent the alpine ecotype and green plants the montane one. The numbers represent differentially expressed genes in different comparisons (adjusted P < 0.05). For simplicity, the two ecotype pairs are here shown on different mountains, but they have been both reared together at the native localities of pair 1.
(b) Multidimensional scaling plot of distances between gene expression profiles of individuals of the two ecotypes grown at different altitudes. Circles and continuous lines represent the ecotype pair 1, and squares and dashed lines the ecotype pair 3. Green‐ and brown‐filled symbols show the montane and alpine ecotypes, respectively, while green and brown symbol margins represent the low and high growing sites, respectively.
