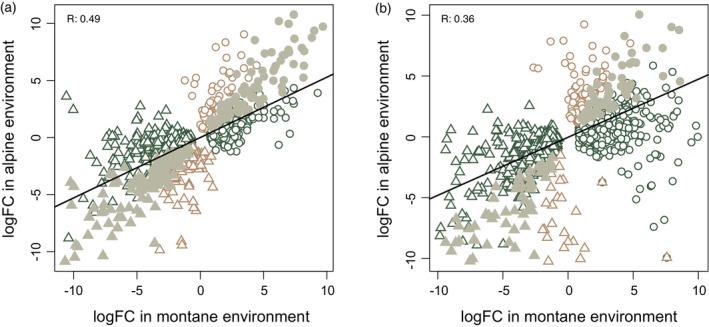
Figure 4.

Differentially expressed (DE) genes between ecotypes in different environments.
The X‐ and Y‐axis show log fold‐change values for genes with differential expression between ecotypes when these are grown in the montane (green and gray symbols) and alpine (brown and gray symbols) environment, respectively, for ecotype pair 1 (a) and 3 (b). Triangles and circles represent genes under‐ and overexpressed in the montane ecotype compared with the alpine, respectively. Gray‐filled symbols show genes with stable, non‐plastic expression divergence between ecotypes, independent of the environment. The black line shows the correlation between gene expression changes in the montane and alpine environments.
