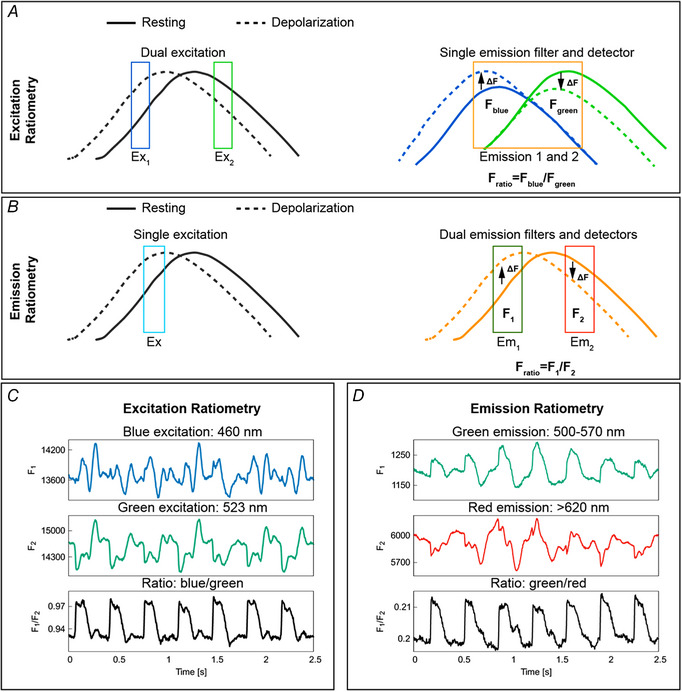
Figure 4. Excitation and emission ratiometry.

A, schematic representation of excitation ratiometry using Di‐4‐ANEPPS. Excitation ratiometry uses two excitation light sources to excite the dye and a single emission filter–camera combination to collect the action potential‐modulated fluorescent light. Exciting the dye with blue and green excitation wavelengths produces positive (dashed blue line above the continuous blue line) and negative (dashed green line below the continuous green line) fractional change in fluorescence (∆F) during action potential depolarization. The emission filter–camera combination collects emitted fluorescent light for blue and green excitation; taking the ratio of the fluorescence intensities minimizes the motion artifacts originating from illumination and dye loading inhomogeneities. B, principle of emission ratiometry. Emission ratiometry uses a single excitation light to excite the dye and two emission wavelength bands (with positive and negative ∆F) to collect the voltage‐dependent fluorescence emission. The emission filters transmit the fluorescent light into two cameras that are aligned to look at the same portion of the cardiac tissue. The ratio of the fluorescence intensities of the two cameras reduces dye loading and illumination motion artifacts. C, example of OAP signals showing motion artifact reduction using excitation ratiometry. D, motion artifact reduction using emission ratiometry.
