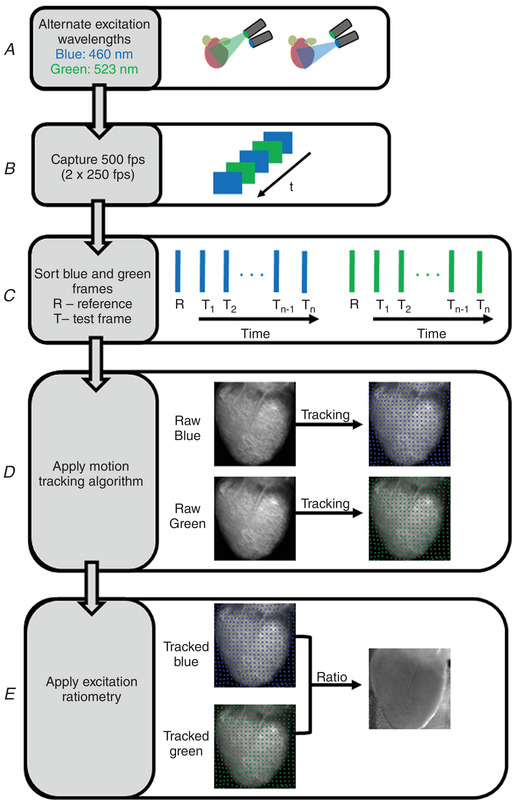
Figure 5. Combination of excitation ratiometry and motion tracking.

Flowchart representation of motion correction technique in optical mapping studies of beating hearts. A, Langendorff‐perfused contracting hearts stained with Di‐4‐ANEPPS are illuminated with blue and green LEDs that are interlaced in time. B, the LED switching (500 Hz) is synchronized with the camera (500 fps) such that odd frames of camera record optical action potential for blue excitation and even camera frames of camera record action potentials for green excitation (or vice versa). C, sorting of camera frames into odd and even corresponding to blue (raw blue) and green (raw green) excitation. D, application of motion tracking algorithm to optical mapping videos of blue and green excitation separately. E, the ratio between motion‐tracked videos of blue (tracked blue) and green (tracked green) excitation is computed to minimize motion artifacts.
