
Fig. 5.
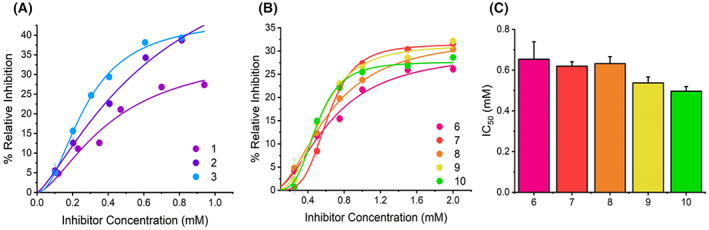
Concentration dependence of MAO‐B inhibition by SCRA compounds. (A) Concentration dependence of SCRA compounds 1–3 versus rate of MAO‐B turnover at 25 °C. Solid lines are the fit of the data to Eqn (2). (B) Concentration dependence of compounds 6–10 versus rate of MAO‐B turnover at 25 °C. Solid lines are the fit of the data to Eqn (2). (C) Resulting IC50 values depicting the inhibition potency of compounds 6–10. Conditions, 30 μm MAO‐B, 1.5 mm BZA, 50 mm HEPES, pH 7.5 + 0.5% Triton X‐100, All data were collected in triplicate and error bars indicate standard error.