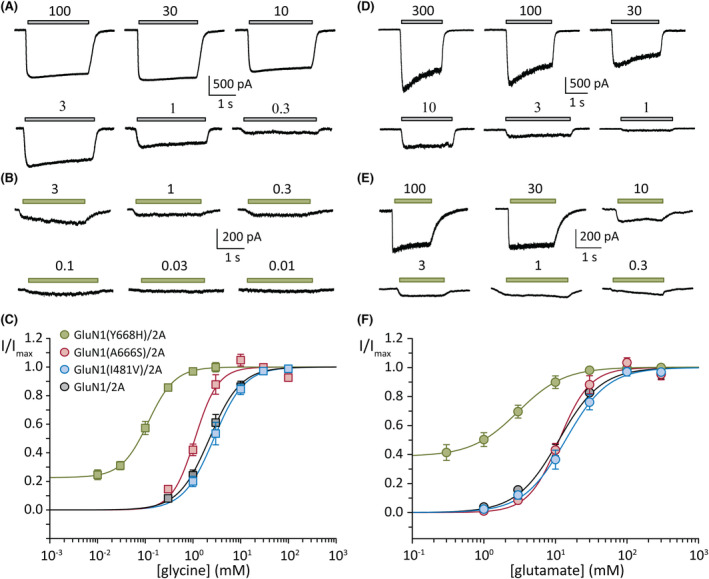
FIGURE 3.

Concentration–response plots of glycine and glutamate. (A, B) Representative whole‐cell currents in response to the indicated micromolar concentrations of glycine (and half‐maximal effective concentration [EC50] of glutamate) from cells expressing the wild‐type (WT) GluN1/2A (A) and GluN1(Y668H)/2A variant (B) receptors. (C) Normalized glycine concentration–response plots of group data for the indicated WT and variant receptors. (D, E) Representative whole‐cell currents in response to the indicated micromolar concentrations of glutamate (and an EC50 concentration of glycine) from cells expressing the WT GluN1/2A (D) and GluN1(Y668H)/2A variant (E) receptors. (C) Normalized glutamate concentration–response plots of group data for the indicated WT and variant receptors. Currents were obtained at a holding potential of −70 mV.
